Download
1 / 1
10 likes | 107 Vues
The Effect of Temperature and Colored Light on the Growth of C. elegans Katrina Weberg and Aaron Wilson, Biology Department, University of Wisconsin River Falls. ABSTRACT

E N D
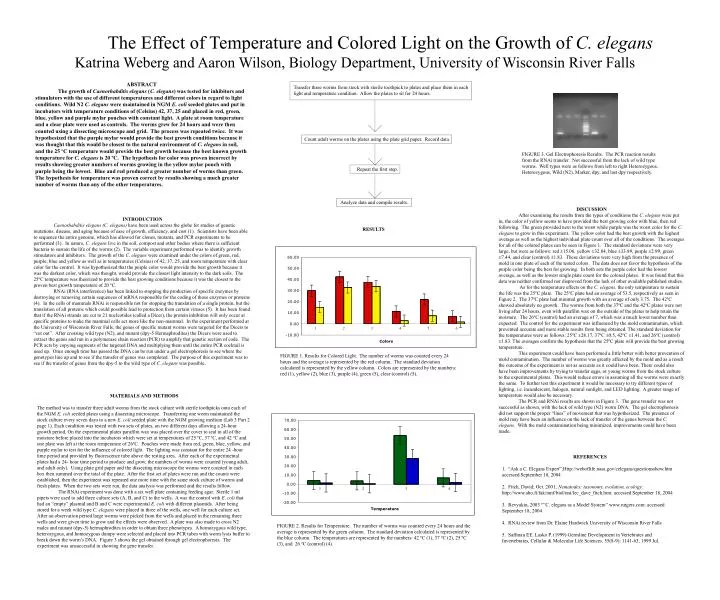
The Effect of Temperature and Colored Light on the Growth of C. elegans Katrina Weberg and Aaron Wilson, Biology Department, University of Wisconsin River Falls ABSTRACT The growth of Caenorhabditis elegans (C. elegans) was tested for inhibitors and stimulators with the use of different temperatures and different colors in regard to light conditions. Wild N2 C. elegans were maintained in NGM E. coli seeded plates and put in incubators with temperature conditions of (Celsius) 42, 37, 25 and placed in red, green, blue, yellow and purple mylar pouches with constant light. A plate at room temperature and a clear plate were used as controls. The worms grew for 24 hours and were then counted using a dissecting microscope and grid. The process was repeated twice. It was hypothesized that the purple mylar would provide the best growth conditions because it was thought that this would be closest to the natural environment of C. elegans in soil, and the 25 ºC temperature would provide the best growth because the best known growth temperature for C. elegans is 20 ºC. The hypothesis for color was proven incorrect by results showing greater numbers of worms growing in the yellow mylar pouch with purple being the lowest. Blue and red produced a greater number of worms than green. The hypothesis for temperature was proven correct by results showing a much greater number of worms than any of the other temperatures. Transfer three worms from stock with sterile toothpick to plates and place them in each light and temperature condition. Allow the plates to sit for 24 hours. Count adult worms on the plates using the plate grid paper. Record data. FIGURE 3. Gel Electrophoresis Results. The PCR reaction results from the RNAi transfer. Not successful from the lack of wild type worms. Well types were as follows from left to right Heterozygous, Heterozygous, Wild (N2), Marker, dpy, and last dpy respectively. Repeat the first step. Analyze data and compile results. DISCUSSION After examining the results from the types of conditions the C. elegans were put in, the color of yellow seems to have provided the best growing color with blue, then red following. The green provided next to the worst while purple was the worst color for the C. elegans to grow in this experiment. The yellow color had the best growth with the highest average as well as the highest individual plate count over all of the conditions. The averages for all of the colored plates can be seen in Figure 1. The standard deviations were very large, but were as follows: red 15.06, yellow 32.84, blue 33.89, purple 2.99, green 7.44, and clear (control) 1.83. These deviations were very high from the presence of mold in one plate of each of the tested colors. The data does not favor the hypothesis of the purple color being the best for growing. In both sets the purple color had the lowest average, as well as the lowest single plate count for the colored plates. It was found that this data was neither confirmed nor disproved from the lack of other available published studies. As for the temperature effects on the C. elegans, the only temperature to sustain the life was the 25ºC plate. The 25ºC plate had an average of 53.5, respectively as seen in Figure 2. The 37ºC plate had minimal growth with an average of only 3.75. The 42ºC showed absolutely no growth. The worms from both the 37ºC and the 42ºC plates were not living after 24 hours, even with parafilm wax on the outside of the plates to help retain the moisture. The 26ºC (control) had an average of 7, which was a much lower number than expected. The control for the experiment was influenced by the mold contamination, which prevented accurate and more stable results from being obtained. The standard deviation for the temperatures were as follows: 25ºC 28.17, 37ºC 0.5, 42ºC 1.41, and 26ºC (control) 1.83. The averages confirm the hypothesis that the 25ºC plate will provide the best growing temperature. This experiment could have been performed a little better with better prevention of mold contamination. The number of worms was greatly affected by the mold and as a result the outcome of the experiment is not as accurate as it could have been. There could also have been improvements by trying to transfer eggs, or young worms from the stock culture to the experimental plates. This would reduce errors in assuming all the worms were exactly the same. To further test this experiment it would be necessary to try different types of lighting, i.e. incandescent, halogen, natural sunlight, and LED lighting. A greater range of temperature would also be necessary. The PCR and RNAi results are shown in Figure 3. The gene transfer was not successful as shown, with the lack of wild type (N2) worm DNA. The gel electrophoresis did not support the proper “lines” of movement that was hypothesized. The presence of mold may have been an influence on the lack of transfer of the genes between the C. elegans. With the mold contamination being minimized, improvements could have been made. INTRODUCTION Caenorhabditis elegans (C. elegans) have been used across the globe for studies of genetic mutations, disease, and aging because of ease of growth, efficiency, and cost (1). Scientists have been able to sequence the entire genome, which has allowed for clones, mutants, and PCR experiments to be performed (3). In nature, C. elegans live in the soil, compost and other bodies where there is sufficient bacteria to sustain the life of the worms (2). The variable experiment performed was to identify growth stimulators and inhibitors. The growth of the C. elegans were examined under the colors of green, red, purple, blue and yellow as well as in temperatures (Celsius) of 42, 37, 25, and room temperature with clear color for the control. It was hypothesized that the purple color would provide the best growth because it was the darkest color, which was thought, would provide the closest light intensity to the dark soils. The 25ºC temperature was theorized to provide the best growing conditions because it was the closest to the proven best growth temperature of 20 ºC. RNAi (RNA interference) has been linked to stopping the production of specific enzymes by destroying or removing certain sequences of mRNA responsible for the coding of those enzymes or proteins (4). In the cells of mammals RNAi is responsible not for stopping the translation of a single protein, but the translation of all proteins which could possible lead to protection from certain viruses (5). It has been found that if the RNAi strands are cut to 21 nucleotides (called a Dicer), the protein inhibition will only occur at specific proteins to make the mammal cells act more like the non-mammal. In the experiment performed at the University of Wisconsin River Falls, the genes of specific mutant worms were targeted for the Dicers to “cut out”. After crossing wild type (N2), and mutant (dpy-5 Hermaphrodites) the Dicers were used to extract the genes and run in a polymerase chain reaction (PCR) to amplify that genetic section of code. The PCR acts by copying segments of the targeted DNA and multiplying them until the entire PCR cocktail is used up. Once enough time has passed the DNA can be run under a gel electrophoresis to see where the genotypes line up and to see if the transfer of genes was completed. The purpose of this experiment was to see if the transfer of genes from the dpy-5 to the wild type of C. elegans was possible. RESULTS FIGURE 1. Results for Colored Light. The number of worms was counted every 24 hours and the average is represented by the red column. The standard deviation calculated is represented by the yellow column. Colors are represented by the numbers: red (1), yellow (2), blue (3), purple (4), green (5), clear (control) (5). MATERIALS AND METHODS The method was to transfer three adult worms from the stock culture with sterile toothpicks onto each of the NGM E. coli seeded plates using a dissecting microscope. Transferring one worm maintained the stock culture every seven days to a new E. coli seeded plate with the NGM growing medium (Lab 3 Part 2 page 1). Each condition was tested with two sets of plates, on two different days allowing a 24-hour growth period. On the experimental plates parafilm wax was placed over the cover to seal in all of the moisture before placed into the incubators which were set at temperatures of 25 ºC, 37 ºC, and 42 ºC and one plate was left at the room temperature of 26ºC. Pouches were made from red, green, blue, yellow, and purple mylar to test for the influence of colored light. The lighting was constant for the entire 24 -hour time period and provided by fluorescence tube above the testing area. After each of the experimental plates had a 24- hour time period to produce and grow, the numbers of worms were counted (young adult, and adult only). Using plate grid paper and the dissecting microscope the worms were counted in each box then summed over the total of the plate. After the first set of plates were run and the counts were established, then the experiment was repeated one more time with the same stock culture of worms and fresh plates. When the two sets were run, the data analysis was performed and the results follow. The RNAi experiment was done with a six well plate containing feeding agar. Sterile 1 ml pipets were used to add three culture sets (A, B, and C) to the wells. A was the control with E. coli that had an “empty” plasmid and B and C were experimental E. coli with different plasmids. After being stored for a week wild type C. elegans were placed in three of the wells, one well for each culture set. After an observation period large worms were picked from the wells and placed in the remaining three wells and were given time to grow and the effects were observed. A plate was also made to cross N2 males and mutant (dpy-5) hermaphrodites in order to obtain three phenotypes. A homozygous wild type, heterozygous, and homozygous dumpy were selected and placed into PCR tubes with worm lysis buffer to break down the worm’s DNA. Figure 3 shows the gel obtained through gel electrophoresis. The experiment was unsuccessful in showing the gene transfer. REFERENCES 1. “Ask a C. Elegans Expert”;Http://weboflife.nasa.gov/celegans/questionsshow.htm accessed September 18, 2004 2. Fitch, David; Oct. 2001; Nematodes: taxonomy, evolution, ecology: http://www.abo.fi/fak/mnf/biol/nni/lec_dave_fitch.htm: accessed September 18, 2004 3. Revyakin, 2003 “”C. elegans as a Model System” www.rutgers.com: accessed September 18, 2004 4. RNAi review from Dr. Elaine Hardwick University of Wisconsin River Falls 5. Saffman EE. Lasko P. (1999) Germline Development in Vertebrates and Invertebrates, Cellular & Molecular Life Sciences. 55(8-9): 1141-63, 1999 Jul. FIGURE 2. Results for Temperature. The number of worms was counted every 24 hours and the average is represented by the green column. The standard deviation calculated is represented by the blue column. The temperatures are represented by the numbers: 42 ºC (1), 37 ºC (2), 25 ºC (3), and 26 ºC (control) (4).