Download
1 / 7
70 likes | 142 Vues
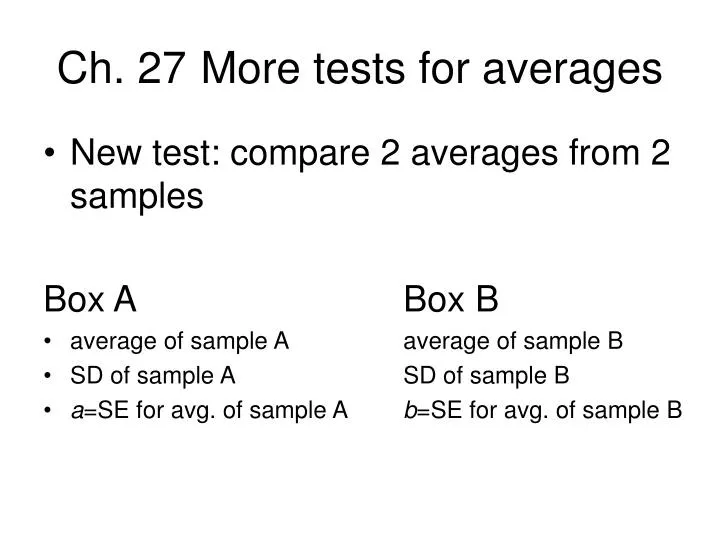
Ch. 27 More tests for averages. New test: compare 2 averages from 2 samples Box A Box B average of sample A average of sample B SD of sample A SD of sample B a =SE for avg. of sample A b =SE for avg. of sample B. Null hypothesis: Average of box A = Average of box B

E N D
Ch. 27 More tests for averages • New test: compare 2 averages from 2 samples Box A Box B • average of sample A average of sample B • SD of sample A SD of sample B • a=SE for avg. of sample A b=SE for avg. of sample B
Null hypothesis: Average of box A = Average of box B • Expected: average of sample A – average of sample B = 0 • Observed: average of sample A – average of sample B • SE for difference of averages =
Example 1 Ch.27 B #3 p.509 • Example 2 Ch. 27 B #4 p.509 • This same method can be used for proportions and percentiles. • Example 3 Ch. 27 B #8 p. 510
Summary • SE for difference = • This is true for averages, proportions, and percentiles. • Called a 2-sample t-test or z-test. • When do we use this test? • Sample with replacement • 2 independent samples
Examples of when to use this test: • Ch. 26 C #7 • Tax returns: Sample 2 numbers per return – the difference is on the ticket – NOT independent. • Roll die 100 times and compare the percent of 1’s to percent of 3’s. • Experiments • Randomized controlled experiment • Compare 2 groups
This violates the assumption that we have 2 independent samples. • The 2 samples are not independent • The sampling is without replacement • However, we assume that the effects of these 2 violations cancel each other out. • Illustration using a box model: Each ticket has 2 numbers, 1 for result if in treatment group and 1 for result if in control group.
Draw a sample of tickets without replacement, observe to responses that relate to the treatment. • Draw a sample without replacement from the remaining tickets, observe the response that relate to the control. • Example 4: Ch. 27 C #2 p.513