1 / 1

A-43

Table 5.7: Distribution of RN Workforce by Age Group, 1980 – 2008.

tyler
Télécharger la présentation

A-43

An Image/Link below is provided (as is) to download presentation Download Policy: Content on the Website is provided to you AS IS for your information and personal use and may not be sold / licensed / shared on other websites without getting consent from its author. Content is provided to you AS IS for your information and personal use only. Download presentation by click this link. While downloading, if for some reason you are not able to download a presentation, the publisher may have deleted the file from their server. During download, if you can't get a presentation, the file might be deleted by the publisher.

E N D

Presentation Transcript


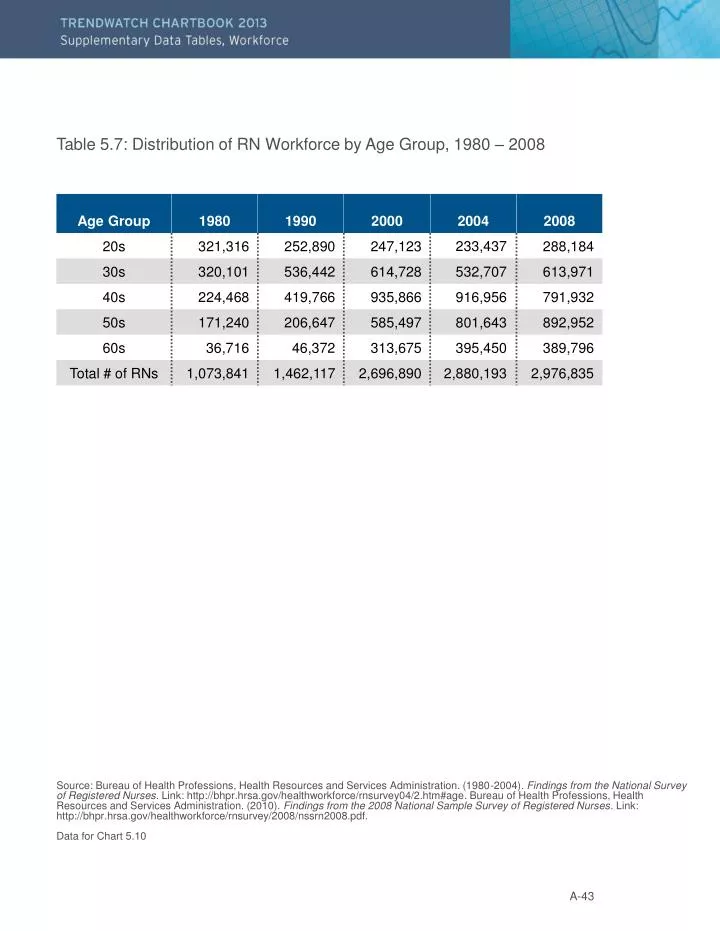
  1. Table 5.7: Distribution of RN Workforce by Age Group, 1980 – 2008 Source: Bureau of Health Professions, Health Resources and Services Administration. (1980-2004). Findings from the National Survey of Registered Nurses. Link: http://bhpr.hrsa.gov/healthworkforce/rnsurvey04/2.htm#age. Bureau of Health Professions, Health Resources and Services Administration. (2010). Findings from the 2008 National Sample Survey of Registered Nurses. Link: http://bhpr.hrsa.gov/healthworkforce/rnsurvey/2008/nssrn2008.pdf. Data for Chart 5.10 A-43

More Related