Download
1 / 61
670 likes | 943 Vues
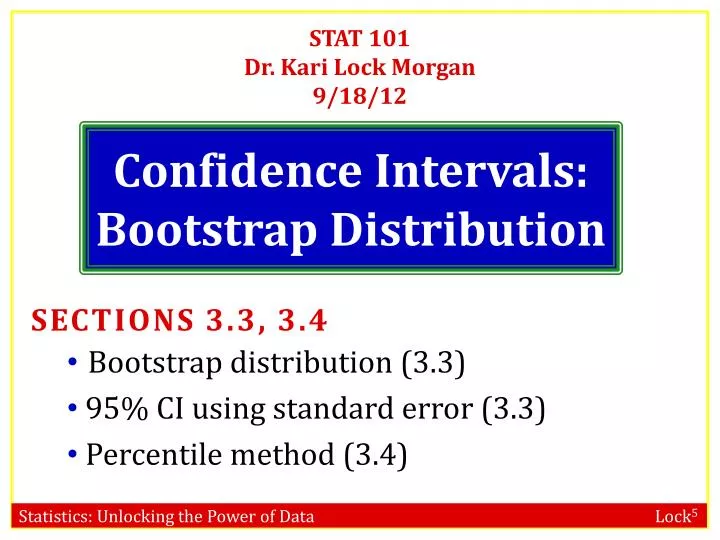
STAT 101 Dr. Kari Lock Morgan 9/18/12. Confidence Intervals: Bootstrap Distribution. SECTIONS 3.3, 3.4 Bootstrap distribution (3.3) 95% CI using standard error (3.3) Percentile method (3.4). Common Misinterpretations. “A 95% confidence interval contains 95% of the data in the population”

E N D
STAT 101 Dr. Kari Lock Morgan 9/18/12 Confidence Intervals: Bootstrap Distribution • SECTIONS 3.3, 3.4 • Bootstrap distribution (3.3) • 95% CI using standard error (3.3) • Percentile method (3.4)
Common Misinterpretations • “A 95% confidence interval contains 95% of the data in the population” • “I am 95% sure that the mean of a sample will fall within a 95% confidence interval for the mean” • “The probability that the population parameter is in this particular 95% confidence interval is 0.95”
Standard Error The standard errorof a statistic, SE, is the standard deviation of the sample statistic • The standard error can be calculated as the standard deviation of the sampling distribution
Confidence Intervals Sample Sample Sample Sample Sample Sample Confidence Interval statistic ± ME Population . . . Margin of Error (ME) (95% CI: ME = 2×SE) Sampling Distribution Calculate statistic for each sample Standard Error (SE): standard deviation of sampling distribution
Summary • To create a plausible range of values for a parameter: • Take many random samples from the population, and compute the sample statistic for each sample • Compute the standard error as the standard deviation of all these statistics • Use statistic 2SE • One small problem…
Reality • … WE ONLY HAVE ONE SAMPLE!!!! • How do we know how much sample statistics vary, if we only have one sample?!? BOOTSTRAP!
ONE Reese’s Pieces Sample Sample: 52/100 orange Where might the “true” p be?
“Population” • Imagine the “population” is many, many copies of the original sample • (What do you have to assume?)
Reese’s Pieces “Population” Sample repeatedly from this “population”
Sampling with Replacement • To simulate a sampling distribution, we can just take repeated random samples from this “population” made up of many copies of the sample • In practice, we can’t actually make infinite copies of the sample… • … but we can do this by sampling with replacement from the sample we have (each unit can be selected more than once)
Original Sample A simulated “population” to sample from
Bootstrap Sample: Sample with replacement from the original sample, using the same sample size. Original Sample Bootstrap Sample
Reese’s Pieces • How would you take a bootstrap sample from your sample of Reese’s Pieces?
Bootstrap A bootstrap sampleis a random sample taken with replacement from the original sample, of the same size as the original sample A bootstrap statisticis the statistic computed on a bootstrap sample A bootstrap distributionis the distribution of many bootstrap statistics
BootstrapSample Bootstrap Statistic BootstrapSample Bootstrap Statistic Original Sample Bootstrap Distribution . . . . . . Sample Statistic BootstrapSample Bootstrap Statistic
Bootstrap Sample Your original sample has data values 18, 19, 19, 20, 21 Is the following a possible bootstrap sample? • 18, 19, 20, 21, 22 • Yes • No 22 is not a value from the original sample
Bootstrap Sample Your original sample has data values 18, 19, 19, 20, 21 Is the following a possible bootstrap sample? • 18, 19, 20, 21 • Yes • No Bootstrap samples must be the same size as the original sample
Bootstrap Sample Your original sample has data values 18, 19, 19, 20, 21 Is the following a possible bootstrap sample? • 18, 18, 19, 20, 21 • Yes • No Same size, could be gotten by sampling with replacement
Bootstrap Sample You have a sample of size n = 50. You sample with replacement 1000 times to get 1000 bootstrap samples. What is the sample size of each bootstrap sample? 50 1000 Bootstrap samples are the same size as the original sample
Bootstrap Distribution You have a sample of size n = 50. You sample with replacement 1000 times to get 1000 bootstrap samples. How many bootstrap statistics will you have? 50 1000 One bootstrap statistic for each bootstrap sample
Why “bootstrap”? “Pull yourself up by your bootstraps” • Lift yourself in the air simply by pulling up on the laces of your boots • Metaphor for accomplishing an “impossible” task without any outside help
StatKey lock5stat.com/statkey/
Sampling Distribution Population BUT, in practice we don’t see the “tree” or all of the “seeds” – we only have ONE seed µ
Bootstrap Distribution What can we do with just one seed? Bootstrap “Population” Estimate the distribution and variability (SE) of ’s from the bootstraps Grow a NEW tree! µ
Golden Rule of Bootstrapping • Bootstrap statistics are to the original sample statistic • as • the original sample statistic is to the population parameter
Standard Error • The variability of the bootstrap statistics is similar to the variability of the sample statistics • The standard error of a statistic can be estimated using the standard deviation of the bootstrap distribution!
Confidence Intervals Bootstrap Sample Bootstrap Sample Bootstrap Sample Bootstrap Sample Bootstrap Sample Confidence Interval statistic ± ME Sample Margin of Error (ME) (95% CI: ME = 2×SE) . . . Bootstrap Distribution Calculate statistic for each bootstrap sample Standard Error (SE): standard deviation of bootstrap distribution
Reese’s Pieces Based on this sample, give a 95% confidence interval for the true proportion of Reese’s Pieces that are orange. (0.47, 0.57) (0.42, 0.62) (0.41, 0.51) (0.36, 0.56) I have no idea 0.52 ± 2 × 0.05
What about Other Parameters? • Estimate the standard error and/or a confidence interval for... • proportion () • difference in means () • difference in proportions () • standard deviation () • correlation () • ... Generate samples with replacement Calculate sample statistic Repeat...
The Magic of Bootstrapping • We can use bootstrapping to assess the uncertainty surrounding ANY sample statistic! • If we have sample data, we can use bootstrapping to create a 95% confidence interval for any parameter! • (well, almost…)
Atlanta Commutes What’s the mean commute time for workers in metropolitan Atlanta? Data: The American Housing Survey (AHS) collected data from Atlanta in 2004
Random Sample of 500 Commutes Where might the “true” μ be? WE CAN BOOTSTRAP TO FIND OUT!!!
“Population” = many copies of sample Sample from this “population”
Atlanta Commutes 29.11 ± 2 × 0.915 95% confidence interval for the average commute time for Atlantans: (a) (28.2, 30.0) (b) (27.3, 30.9) (c) 26.6, 31.8 (d) No idea
Global Warming • What percentage of Americans believe in global warming? • A survey on 2,251 randomly selected individuals conducted in October 2010 found that 1328 answered “Yes” to the question • “Is there solid evidence of global warming?” www.lock5stat.com/statkey Source: “Wide Partisan Divide Over Global Warming”, Pew Research Center, 10/27/10. http://pewresearch.org/pubs/1780/poll-global-warming-scientists-energy-policies-offshore-drilling-tea-party
Global Warming www.lock5stat.com/statkey We are 95% sure that the true percentage of all Americans that believe there is solid evidence of global warming is between 57% and 61%
Global Warming • Does belief in global warming differ by political party? • “Is there solid evidence of global warming?” • The sample proportion answering “yes” was 79% among Democrats and 38% among Republicans. • (exact numbers for each party not given, but assume n=1000 for each group) • Give a 95% CI for the difference in proportions. www.lock5stat.com/statkey Source: “Wide Partisan Divide Over Global Warming”, Pew Research Center, 10/27/10. http://pewresearch.org/pubs/1780/poll-global-warming-scientists-energy-policies-offshore-drilling-tea-party
Global Warming www.lock5stat.com/statkey We are 95% sure that the difference in the proportion of Democrats and Republicans who believe in global warming is between 0.37 and 0.45.
Global Warming • Based on the data just analyzed, can you conclude with 95% certainty that the proportion of people believing in global warming differs by political party? • (a) Yes • (b) No Yes. We are 95% confident that the difference is between 0.37 and 0.45, and this interval does not include 0 (no difference)
Body Temperature • What is the average body temperature of humans? www.lock5stat.com/statkey We are 95% sure that the average body temperature for humans is between 98.05 and 98.47 98.6 ??? Shoemaker, What's Normal: Temperature, Gender and Heartrate, Journal of Statistics Education, Vol. 4, No. 2 (1996)
Other Levels of Confidence • What if we want to be more than 95% confident? • How might you produce a 99% confidence interval for the average body temperature?
Percentile Method • For a P% confidence interval, keep the middle P% of bootstrap statistics • For a 99% confidence interval, keep the middle 99%, leaving 0.5% in each tail. • The 99% confidence interval would be • (0.5th percentile, 99.5th percentile) • where the percentiles refer to the bootstrap distribution.
Body Temperature www.lock5stat.com/statkey We are 99% sure that the average body temperature is between 98.00 and 98.58
Level of Confidence • Which is wider, a 90% confidence interval or a 95% confidence interval? • (a) 90% CI • (b) 95% CI A 95% CI contains the middle 95%, which is more than the middle 90%
Mercury and pH in Lakes • For Florida lakes, what is the correlation between average mercury level (ppm) in fish taken from a lake and acidity (pH) of the lake? Give a 90% CI for Lange, Royals, and Connor, Transactions of the American Fisheries Society (1993)
Mercury and pH in Lakes www.lock5stat.com/statkey We are 90% confident that the true correlation between average mercury level and pH of Florida lakes is between -0.702 and -0.433.
Bootstrap CI Option 1: Estimate the standard error of the statistic by computing the standard deviation of the bootstrap distribution, and then generate a 95% confidence interval by Option 2: Generate a P% confidence interval as the range for the middle P% of bootstrap statistics