Download
1 / 1
10 likes | 109 Vues
Distribution of hypermethylated CpG loci with respect to genomic location. Distribution of hypermethylated CpG loci with respect to gene features. Grade II astrocytoma. Island (35.6%) . 1 st exon (8.9%) . Island (72.7%) . 1 st exon (8.4%) . Island (67.9%) . 1 st exon (6.3%) .

E N D
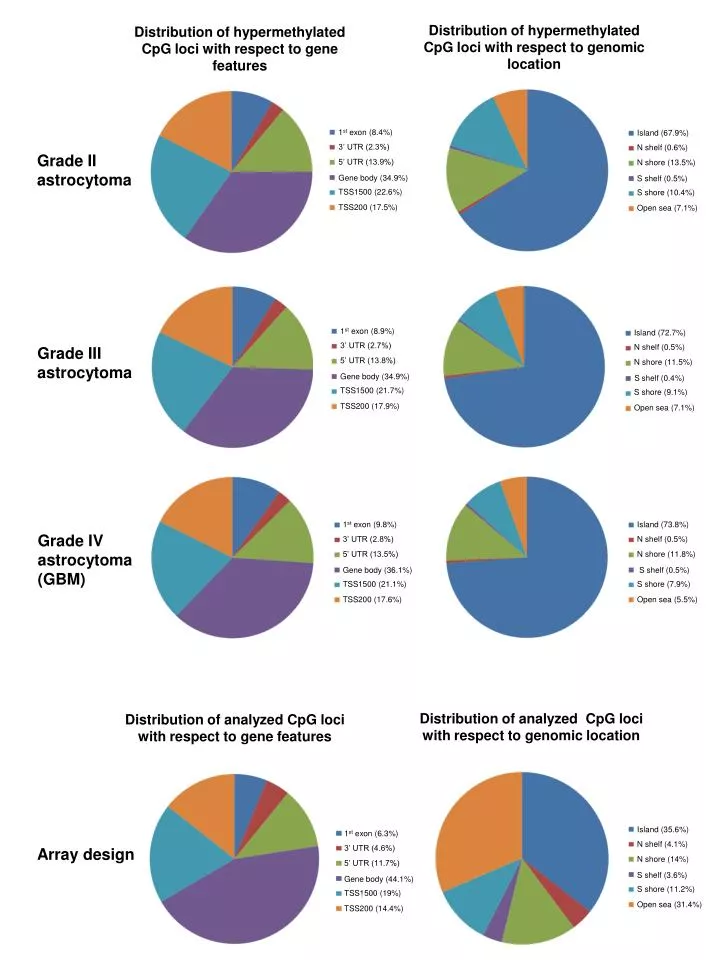
Distribution of hypermethylatedCpG loci with respect to genomic location Distribution of hypermethylatedCpG loci with respect to gene features Grade II astrocytoma Island (35.6%) 1st exon (8.9%) Island (72.7%) 1st exon (8.4%) Island (67.9%) 1st exon (6.3%) 1st exon (9.8%) Island (73.8%) 3’ UTR (2.7%) N shelf (0.5%) N shelf (0.5%) 3’ UTR (2.3%) N shelf (0.6%) 3’ UTR (4.6%) 3’ UTR (2.8%) N shelf (4.1%) N shore (11.5%) 5’ UTR (11.7%) 5’ UTR (13.9%) N shore (11.8%) 5’ UTR (13.5%) N shore (14%) 5’ UTR (13.8%) N shore (13.5%) S shelf (0.4%) Gene body (44.1%) Gene body (34.9%) Gene body (36.1%) Gene body (34.9%) S shelf (0.5%) S shelf (0.5%) S shelf (3.6%) S shore (9.1%) TSS1500 (22.6%) TSS1500 (21.1%) S shore (11.2%) S shore (10.4%) TSS1500 (21.7%) S shore (7.9%) TSS1500 (19%) TSS200 (14.4%) Open sea (31.4%) Open sea (5.5%) Open sea (7.1%) Open sea (7.1%) TSS200 (17.9%) TSS200 (17.5%) TSS200 (17.6%) Grade III astrocytoma Grade IV astrocytoma (GBM) Distribution of analyzed CpG loci with respect to genomic location Distribution of analyzed CpG loci with respect to gene features Array design