Download
1 / 19
230 likes | 254 Vues
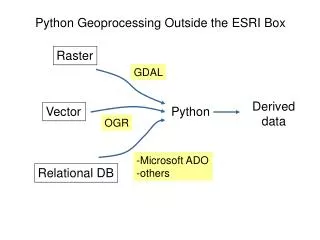
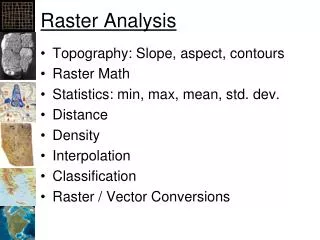
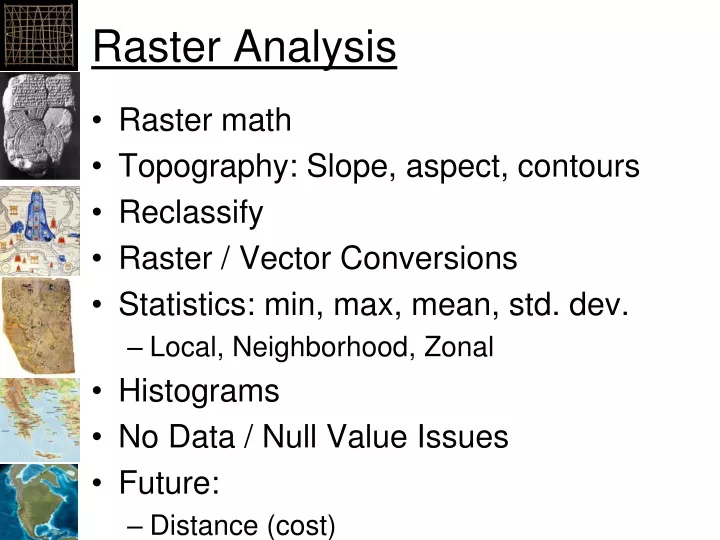
Raster Analysis. Raster math Topography: Slope, aspect, contours Reclassify Raster / Vector Conversions Statistics: min, max, mean, std. dev. Local, Neighborhood, Zonal Histograms No Data / Null Value Issues Future: Distance (cost). Jim’s Secrets for Rasters.

E N D
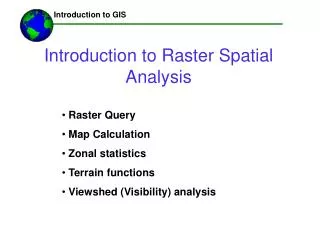
Raster Analysis • Raster math • Topography: Slope, aspect, contours • Reclassify • Raster / Vector Conversions • Statistics: min, max, mean, std. dev. • Local, Neighborhood, Zonal • Histograms • No Data / Null Value Issues • Future: • Distance (cost)
Jim’s Secrets for Rasters • Keep the overall size of the rasters below 200 Meg • Use “Resample” to convert to relatively small “IMG” files (or GRIDS) • Data Management Tools -> Raster -> Raster Processing -> Resample • Watch “Results” for errors • Geoprocessing -> “Results” • Use “Task Manager” when Arc crashes
Task Manager • Right Click on Menu Bar, “Start Task Manager” • “End Process” on all “Arc” processes
Raster Statistics • Local • Operate on one pixel in each raster • Neighborhood (or Focal) • Operate on a few pixels around each pixel • Zonal • Collection of regions • Region is a contiguous area of the same pixel values • Global • Operate on the “whole” raster
Local Stats • “Cell Statistics” computes stats on all the values for a pixel in a multi-band raster. • Example for “Sum”: Esri ArcGIS 10 Help
Neighborhood (or Focal) • Result=Operation on pixels nearby Columns Rows
Focal Statistics • Computes stats on pixels around an existing pixel • Example for Sum: Esri ArcGIS 10 Help
Zonal Statistics • Computes statistics for defined regions (features) • Tools: • Zonal Statistics: • Outputs a raster (not sure of the value) • Zonal Statistics as Table: • Outputs a table • Used to compute all kinds of valuable things: • Percent land cover • Percent impervious cover • Percent water below a certain depth • Etc.
Zonal Statistics Zone Layer Value layer Output layer (or table) Esri ArcGIS 10 Help
Conditional Operator • Con(<condition>,<true>,<false>) • Given a raster “condition”: • Puts the true value where true and false value where false Con!
Elevations over 3000 meters • Con("W100N40.DEM“>3000,0,1)
Convert Values to “No Data” SetNull("W100N40.DEM"==55537,"W100N40.DEM")
Rasters Draw as “Solid” Color • Click on “Type:” and select “Minimum-Maximum” • ArcGIS will compute statistics