Download
1 / 1
10 likes | 137 Vues
Urban Freight Congestion in Portland, OR. Methodology. Abstract. While the project is in the data-collection and background research phase, there are several studies that utilize methodologies to consider for this research.

E N D
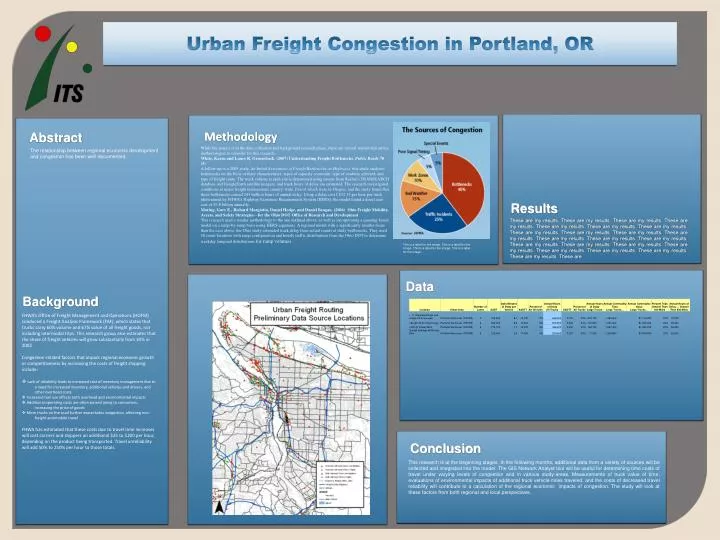
Urban Freight Congestion in Portland, OR Methodology Abstract While the project is in the data-collection and background research phase, there are several studies that utilize methodologies to consider for this research. White, Karen and Lance R. Grenzeback. (2007) Understanding Freight Bottlenecks. Public Roads 70 (5) A follow-up to a 2005 study, An Initial Assessment of Freight Bottlenecks on Highways, this study analyzes bottlenecks on the basis of three characteristics: types of capacity constraint, type of roadway affected, and type of freight route. The truck volume at each site is determined using counts from Reebie’s TRANSEARCH database and GoogleEarth satellite imagery, and truck hours of delay are estimated. The research investigated conditions at major freight intersections country-wide, five of which were in Oregon, and the study found that these bottlenecks caused 243 million hours of annual delay. Using a delay cost f $32.15 per hour per truck (determined by FHWA’s Highway Economic Requirements System (HERS), the model found a direct user cost of $7.8 billion annually. Maring, Gary E., Richard Margiotta, Daniel Hodge, and Daniel Beagan. (2006) Ohio Freight Mobility, Access, and Safety Strategies – for the Ohio DOT Office of Research and Development This research used a similar methodology to the one outlined above, as well as incorporating a queuing-based model on a ramp-by-ramp basis using HERS equations. A regional model with a significantly smaller focus than the case above, the Ohio study estimated truck delay from actual counts at study bottlenecks. They used 18 count locations with ramp configuration and hourly traffic distributions from the Ohio DOT to determine weekday temporal distributions for ramp volumes. The relationship between regional economic development and congestion has been well-documented. Results These are my results. These are my results. These are my results. These are my results. These are my results. These are my results. These are my results. These are my results. These are my results. These are my results. These are my results. These are my results. These are my results. These are my results. These are my results. These are my results. These are my results. These are my results. These are my results. These are my results. These are my results. These are my results. These are This is a label for the image. This is a label for the image. This is a label for the image. This is a label for the image. Data Methods Background • FHWA’s Office of Freight Management and Operations (HOFM) conduced a Freight Analysis Framework (FAF), which states that trucks carry 60% volume and 67% value of all freight goods, not including intermodal trips. This research group also estimates that the share of freight vehicles will grow substantially from 30% in 2002 • Congestion-related factors that impact regional economic growth or competitiveness by increasing the costs of freight shipping include: • Lack of reliability leads to increased cost of inventory management due to a need for increased inventory, additional vehicles and drivers, and other overhead costs • Increased fuel use affects both overhead and environmental impacts • Additional operating costs are often passed along to consumers, increasing the price of goods • More trucks on the road further exacerbates congestion, affecting non- freight automobile travel • FHWA has estimated that these costs due to travel time increases will cost carriers and shippers an additional $25 to $200 per hour, depending on the product being transported. Travel unreliability will add 50% to 250% per hour to those totals. Conclusion This research is at the beginning stages. In the following months, additional data from a variety of sources will be collected and integrated into the model. The GIS Network Analyst tool will be useful for determining time costs of travel under varying levels of congestion and in various study-areas. Measurements of truck value of time, evaluations of environmental impacts of additional truck vehicle miles traveled, and the costs of decreased travel reliability will contribute to a calculation of the regional economic impacts of congestion. The study will look at these factors from both regional and local perspectives.