Download
1 / 22
230 likes | 259 Vues
Brain Areas from Brain Imaging. The concept of a sensory modality Comparison of methods for identifying brain areas and function fMRI and its limitations Mapping visual areas in monkey and human brain (e.g. Sereno et al, Science, 1995) Role of attention

E N D
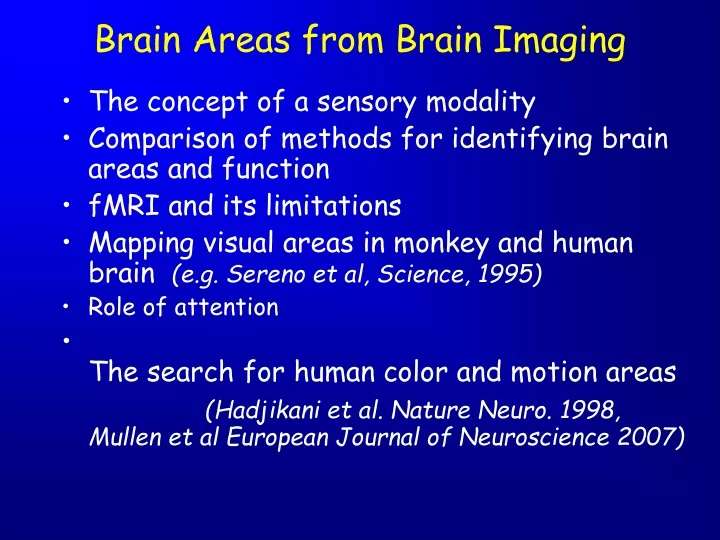
Brain Areas from Brain Imaging • The concept of a sensory modality • Comparison of methods for identifying brain areas and function • fMRI and its limitations • Mapping visual areas in monkey and human brain (e.g. Sereno et al, Science, 1995) • Role of attention • The search for human color and motion areas (Hadjikani et al. Nature Neuro. 1998, Mullen et al European Journal of Neuroscience 2007)
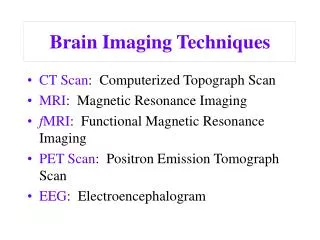
A Sensory Modality • Sensations which resemble each other qualitatively even though they may be quantitatively different. • There are five classic modalities: • vision, hearing, touch, taste & smell • Each sense has distinct submodalities.
What makes one sensation qualitatively different from another? • A thought experiment: connect the rods & cones of the retina to the auditory nerve. • Would you: 1. Hear light? 2. See light? 3. Hear sound?
Temporal and Spatial Resolution of Methods for the Study of Brain Function Note: The grey levels indicate the ‘invasiveness’ of the different methods.
Magnetic Properties of Proton Nucleus of Hydrogen Atom The Hydrogen proton possesses the quantum property of ‘spin’ or angular momentum, and has a small magnetic dipole moment. When placed in a magnetic field, a torque is exerted on the particle, causing it to precess about the applied field.
Spontaneous Decay of Transverse Magnetization Following a radio frequency excitation pulse, the coherent rotation of the ensemble of protons forms a detectable signal. The signal decays spontaneously, at a characteristic rate (T2). At the time the MR signal is sampled (ET), the signal intensity from tissues with a long T2 will be greater than that from tissues with a short T2. Differences in effective T2 form the basis of the contrast for most fMRI methods.
Oxyhemoglobin Increase in Venous Blood During Neuronal Activity During periods of neuronal activity, local blood flow and volume increase with little or no change in oxygen consumption. Consequently, the oxygen content of the venous blood is increased, resulting in an increase in the intensity of the magnetic resonance signal (BOLD)
fMRI • Magnetize subject in a strong field • Causes proton nucleus of H atom to precess in random phase • Apply brief RF EM pulse - causes a transient phase coherence and a brief signal that decays (T2) • Decay is faster for deoxyhemoglobin than oxyhemoglobin revealing areas of stronger blood flow (BOLD)
Limitations of fMRI • Signal limitations • Spatial resolution • Temporal resolution • Others: subjects movement
Visual system Frontal lobe Parietal lobe Occipital lobe V3A V3 Functional subdivisions of the visual cortex V2 V1 Temporal lobe VP Localization Functional assessment V4v MT/V5 Logothetis Scientific American 281, 44-51 , 1999
Eccentricity Expanding annulus of radial checkerboard. Activates all angular directions but varies eccentricity. Polar angle Rotating wedge of radial checker board. Activates all eccentricities but varies angular direction in the visual field
Maps of Human Visual Areas: stimuli with iso-eccentricity and iso-polar angle Isoeccentricity (expanding rings): Color shows response phase. Red/purple = fovea. Polar angle (rotating wedge): Red = lower vertical meridian. Original cortical surface (A), the unfolded cortical surface (B), and the cut and flattened cortical surface (C). Local eccentricity and polar angle were determined by considering the phase of the response to a slowly dilating ring or a slowly rotating hemifield at the dilation or rotation frequency.
Human visual areas on flattened cortex The human visual areas obtained from fMRI retinotopic mapping (1995).Blue & yellow represent mirror and non-mirror representations of the scene. + & - indicate upper and lower visual fields.
Localization: mapped retinotopic areas RA • Automatic volumetric segmentation of human retinotopic cortex • Automatic • No cortical surface required • Directly supplies volumes for VOI analysis V3A V3 V2d V1 V2v VP 10 V4v Sulci Gyri -10 TL V3A V1, V2, V3/VP, V4v, V3A, VO (V8) V3 V3A V3 V2d V2d V1 V1 V2v V2v VP VP V4v V4v Dumoulin et al. (2003)
Retinotopic Visual Areas Retinotopic visual areas in the owl monkey, macaque monkey, and the human, at the same scale. Visual areas in humans show a close resemblance to visual areas originally defined in monkeys. Mapping functions (mm of cortex for each eccentricity) for the upper field representations of human V1. Human V1 has a much greater emphasis on the center-of-gaze compared to the other primates. Eccentricity (degree)
Topography of Color-Selective Activity in Human Visual Cortex A, B. The inferior cortex of 2 subjects (posterior to the left and anterior to the right). C, D. The posterior portion of the cortex is fully flattened. Color-varying stimuli typically produced higher activation in the foveal representation of V1, and often V2 and V3/VP and a distinctive patch of color-selective activation midway in the collateral sulcus.
Retinotopic features of V8 A-C. Retinotopy of polar angle in the inferior row of cortical areas, from three flattened hemispheres. Each panel shows the representations of the contralateral upper quarterfield in inferior V1, then inferior V2, then VP, then V4v. To the right of V4v is the distinctive half-field representation comprising V8. D. Retinotopic representation of eccentricity from the same hemisphere shown in C
Polar Angle Retinotopy of Visual Cortex Macaque (single unit) Human (fMRI) Area MT is shown in grey. In Macaque, dorsal area V4 is also indicated. Retinotopy of V8 is similar to that reported in area TEO, in that both areas are located adjacent to V4v. However, the 2 areas differ in overall shape, and the retinotopy of V8 is rotated approximately 90 degrees relative to that reported in TEO.
Color Afterimages in V8 Perception of color afterimages produces relatively higher activation in V8, compared to other cortical areas. The activation here represents all regions that responded significantly more during viewing of the uniform gray stimulus following the constant color stimulus, compared with viewing of the same gray stimulus following the alternating color stimulus
Evidence That Human V8 and V4v are Distinct Visual Areas • Each area has its own foveal representation (3.5cm apart) • Each has a representation of the upper visual quadrant • V8 has greater color sensitivity than V4v • Their retinotopy differs Note the strong representation of the fovea in V8