Download
1 / 30
300 likes | 402 Vues
Calorimeter technologies for forward region instrumentation. K. Afanaciev 2 , R. Dollan 1 V. Drugakov 2 , C. Grah 1 , E. Kouznetsova 1 , W. Lange 1 , W. Lohmann 1 , A. Stahl 1 1 DESY, Zeuthen 2 NCPHEP, Minsk. Beam Calorimeter : requirements and possible options . ILC bunch:

E N D
Calorimeter technologies for forward region instrumentation K. Afanaciev2, R. Dollan1 V. Drugakov2, C. Grah1, E. Kouznetsova1, W. Lange1, W. Lohmann1, A. Stahl1 1 DESY, Zeuthen 2 NCPHEP, Minsk
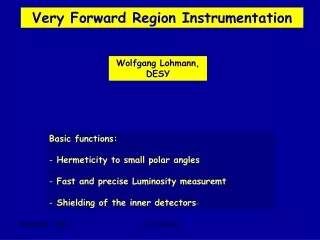
Beam Calorimeter : requirements and possible options • ILC bunch: • small size • high charge • -> beamstrahlung : -> high energy deposition in the BeamCal • BeamCal: (4-28) mrad • fast beam diagnostics • detection and measurement of high energetic electrons and photons at very small angles
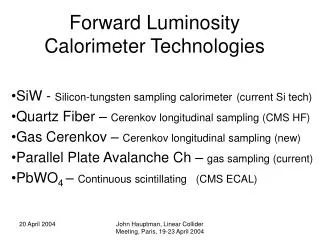
BeamCal: requirement and possible options ~15000 e+e- per BX (10 – 20 TeV) ~10 MGy / year for some area => • radiation hard material • with small Moliere radius Heavy crystal Diamond/Tungsten sandwich
BeamCal: performance simulations diamond/tungsten PbWO4 ½ RM 1X0
Diamond/Tungsten BeamCal: reconstruction efficiency: Fake rate is less then 1% chain of towers at φ = 90° (the most affected) Cells are colored when the efficiency is less then 90% Electrons with energy more then 100 GeV are identified fairly well
PbWO4 BeamCal: reconstruction efficiency: Fake rate is less then 1% segment geometry
CVD Diamond Measurements: Sr90 ADC PA delay diamond discr & Gate discr scint. PM1 PM2 Samples CVD - polycrystalline: • Fraunhofer Institute (Freiburg) • Element6 • GPI (Moscow) Measurements: • Current-Voltage • Charge Collection Efficiency (Charge Collection Distance) Qmeas/Qcreated = CCD/L Qcreated(MIP) = 36 eh/mm
CCD vs HV, time E61: before irradiation HV 100/200/300/400 V Timing 30/30/30/90 min ~30%
CCD vs HV, time FAP6: before irradiation HV 100/200/300/400 V Timing 30/30/30/60 min
~ 0.60 Gy/h ~ 0.15 Gy/h ~20% CCD vs dose: E61: Stable current ~0.3 nA
CCD vs dose: FAP2:
Test Beam : Linearity measurements at High Occupancy Hadronic beam, 3 & 5 GeV Fast extraction ~105-107 / ~10ns Scint.+PMT& Diamond (+ PA) gate signal ADC
Test Beam : Fast Extraction – no PA is needed 17 s 10 ns E6 FAP21
Test Beam : Linearity - some results PMT2 vs PMT1 PMT2 PMTs diamond vs PMT1 diam all pads PMT1 PMT1
Conclusion I: diamond/tungsten option: • Simulation studies shows feasibility of the diamond/tungsten option • Properties of different sensors vary in a wide range • The set of measurements gives information on suitability of a sensor for the BeamCal • This tests together with material analysis (Raman spectrometry, Photoluminescence analysis, Thermally Stimulated Currents) should lead to an optimal choice of the BeamCal sensor material
Heavy Crystal BeamCal with fiber readout • crystals cut into segments in depth • optical isolated fibers • readout with photodetectors material • radiation hard • dense • high lightyield Fiber readout: • lightyield reduction ? • crosstalk between segments ?
SetUp μ- Cosmic - Teleskop Absorber Discriminator PMT - Signals Triggerlogic ADC TDC File direct readout BCF-91A - Fibers: Λ(max. emission) 494 nm -> QE(PMT-XP1911) 13 ± 2 % fiber readout
Direct vs Fiber Readout : example direct readout Absorber fiber readout Absorber
Direct vs Fiber Readout : results Plastic Scintillator Leadglass Direct readout : (QEPMT 25 ± 1 %) Photoelectrons : 390 ± 50 p.e. / µ Lightyield : 1560 ± 260 photons / μ Direct readout : (QEPMT 15 ± 2 %) Photoelectrons : 18.2 ± 2.2 p.e. / µ Lightyield : 120 ± 30 photons / µ Fiber readout : (QEPMT 13 ± 2 %) Photoelectrons : 2.4± 0.5 p.e. / µ Lightyield : 19± 7 photons / µ Fiber readout : (QEPMT 13 ± 2 %) Photoelectrons : 27 ± 4 p.e. / µ Lightyield : 210 ± 60 photons / μ Lightyield reduced to 14 ± 4 % Lightyield reduced to 16± 7 %
Simulation of lightyied reduction GEANT4 • Relevant processes provided by GEANT4, that have to be understood: • Scintillation • Čerenkov radiation • Transport of optical photons in the medium • Reflection • Scattering • photons at material boundaries • Absorption • Reemission • wavelength shifting
Simulation of lightyied reduction geometry Scintillator sample WLS Fiber Air gap Tyvek wrapping Fiber core: Polystyrene, n=1.6 Fiber cladding: Acrylic, n=1.49 Fiber diameter: 1mm, Cladding thickness: 3% of core Ø Channel: 1mmx1mm Optical glue: Epoxy, n=1.56 Scintillator: Polyvinyltoluene, n=1.58
Simulation of lightyied reduction illustration Single muon events Optical photons coupled into the fiber Directly attached to scintillator sample Directly attached to fiber surface PMT Window: Ø 15 mm, thickness 2mm Short absorptionlength -> all photons absorbed Scintillation yield: 50 γ/MeV
Simulation of lightyied reduction plastic scintillator – direct vs fiber readout Spectrum of γ‘s absorbed in the PMT Spectrum of γ‘s absorbed in the PMT in the PMT detected photons per μ Direct readout Fiber readout • γ‘s from Scintillation • γ‘s from Čerenkov • γ‘s from WLS
Simulation of lightyied reduction leadglass – direct vs fiber readout Spectrum of γ‘s absorbed in the PMT Spectrum of γ‘s absorbed in the PMT in the PMT detected photons per μ Fiber readout Direct readout • γ‘s from Scintillation • γ‘s from Čerenkov • γ‘s from WLS
Simulation of lightyied reduction results Plastic Scintillator Leadglass (exp.): Lightyield reduced to 14 ± 4 % (exp.): Lightyield reduced to 16± 7 % (sim.): Lightyield reduced to 8.3 - 12 % (sim.): Lightyield reduced to 9.3 – 9.8 %
Conclusion II: Heavy crystal option: • performance simulations are promising • exp.: lightyield reduced to ~15 % due to fiber readout • fiber readout works • first naive lightyield simulations in good agreement with • experimental results • next steps to include lightyield simulations in the performance simulation • for realistic simulation: • implementation of realistic boundary- and • surface conditiond of the materials and samples • exact WLS-absorption spectrum • better understanding of absorption- and emissions- • behaiviour of the materials • material composition
BeamCal: new physics searches: μ- e ~ μ- χ0 μ+ Z0 ~ μ+ e+ χ0 - e - e g m - m + g + + e e The Physics: production of SUSY particles Signature: μ+ μ-+ missing energy σ ~ 102 fb (SPS1a) The Background: two-photon events Signature: μ+ μ- + missing energy (if electrons are not tagged) σ ~ 106fb NEED: - Excellent electron identification efficiency - Coverage down to as small angle as possible
IV Measurements: • E61 – “Element6”: • 1X1 cm metallization • 500 mm thickness • C = 9.7 pF • FAP6 – Freiburg: • 1X1 cm metallization (4 pads) • 470 mm thickness • C = 9.9 pF
~50% ~ 0.15 Gy/h ~ 0.60 Gy/h CCD vs dose: FAP6:
Test Beam : Fast Extraction - some results: PMT2 PMTs pad1 pad2 PMT1 diam pad3 pad4 all pads PMT1