Download
1 / 1
10 likes | 86 Vues
Introduction This poster shows some preliminary results of the application of MINNI system model to the Trisaia campaign.

E N D
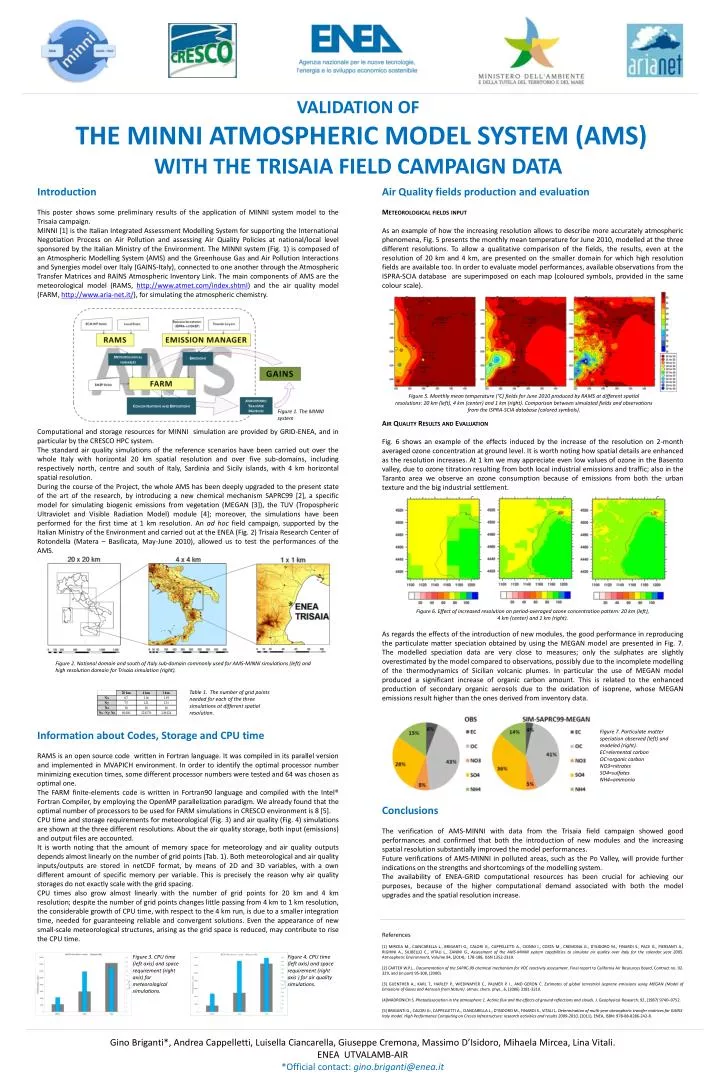
Introduction This poster shows some preliminary results of the application of MINNI system model to the Trisaia campaign. MINNI [1] is the Italian Integrated Assessment Modelling System for supporting the International Negotiation Process on Air Pollution and assessing Air Quality Policies at national/local level sponsored by the Italian Ministry of the Environment. The MINNI system (Fig. 1) is composed of an Atmospheric Modelling System (AMS) and the Greenhouse Gas and Air Pollution Interactions and Synergies model over Italy (GAINS-Italy), connected to one another through the Atmospheric Transfer Matrices and RAINS Atmospheric Inventory Link. The main components of AMS are the meteorological model (RAMS, http://www.atmet.com/index.shtml) and the air quality model (FARM, http://www.aria-net.it/), for simulating the atmospheric chemistry. Computational and storage resources for MINNI simulation are provided by GRID-ENEA, and in particular by the CRESCO HPC system. The standard air quality simulations of the reference scenarios have been carried out over the whole Italy with horizontal 20 km spatial resolution and over five sub-domains, including respectively north, centre and south of Italy, Sardinia and Sicily islands, with 4 km horizontal spatial resolution. During the course of the Project, the whole AMS has been deeply upgraded to the present state of the art of the research, by introducing a new chemical mechanism SAPRC99 [2], a specific model for simulating biogenic emissions from vegetation (MEGAN [3]), the TUV (Tropospheric Ultraviolet and Visible Radiation Model) module [4]; moreover, the simulations have been performed for the first time at 1 km resolution. An ad hoc field campaign, supported by the Italian Ministry of the Environment and carried out at the ENEA (Fig. 2) Trisaia Research Center of Rotondella (Matera – Basilicata, May-June 2010), allowed us to test the performances of the AMS. Air Quality fields production and evaluation Meteorological fields input As an example of how the increasing resolution allows to describe more accurately atmospheric phenomena, Fig. 5 presents the monthly mean temperature for June 2010, modelled at the three different resolutions. To allow a qualitative comparison of the fields, the results, even at the resolution of 20 km and 4 km, are presented on the smaller domain for which high resolution fields are available too. In order to evaluate model performances, available observations from the ISPRA-SCIA database are superimposed on each map (coloured symbols, provided in the same colour scale). VALIDATION ofTHE MINNI Atmospheric Model System (AMS)WITH THE Trisaia field campaign DATA Figure 1. The MINNI system Air Quality Results and Evaluation Fig. 6 shows an example of the effects induced by the increase of the resolution on 2-month averaged ozone concentration at ground level. It is worth noting how spatial details are enhanced as the resolution increases. At 1 km we may appreciate even low values of ozone in the Basento valley, due to ozone titration resulting from both local industrial emissions and traffic; also in the Taranto area we observe an ozone consumption because of emissions from both the urban texture and the big industrial settlement. Figure 5. Monthly mean temperature (°C) fields for June 2010 produced by RAMS at different spatial resolutions: 20 km (left), 4 km (center) and 1 km (right). Comparison between simulated fields and observations from the ISPRA-SCIA database (colored symbols). Figure 2. National domain and south of Italy sub-domain commonly used for AMS-MINNI simulations (left) and high resolution domain for Trisaia simulation (right). Table 1. The number of grid points needed for each of the three simulations at different spatial resolution. As regards the effects of the introduction of new modules, the good performance in reproducing the particulate matter speciation obtained by using the MEGAN model are presented in Fig. 7. The modelled speciation data are very close to measures; only the sulphates are slightly overestimated by the model compared to observations, possibly due to the incomplete modelling of the thermodynamics of Sicilian volcanic plumes. In particular the use of MEGAN model produced a significant increase of organic carbon amount. This is related to the enhanced production of secondary organic aerosols due to the oxidation of isoprene, whose MEGAN emissions result higher than the ones derived from inventory data. Figure 7. Particulate matter speciation observed (left) and modeled (right). EC=elemental carbon OC=organic carbon NO3=nitrates SO4=sulfates NH4=ammonia Information about Codes, Storage and CPU time RAMS is an open source code written in Fortran language. It was compiled in its parallel version and implemented in MVAPICH environment. In order to identify the optimal processor number minimizing execution times, some different processor numbers were tested and 64 was chosen as optimal one. The FARM finite-elements code is written in Fortran90 language and compiled with the Intel® Fortran Compiler, by employing the OpenMP parallelization paradigm. We already found that the optimal number of processors to be used for FARM simulations in CRESCO environment is 8 [5]. CPU time and storage requirements for meteorological (Fig. 3) and air quality (Fig. 4) simulations are shown at the three different resolutions. About the air quality storage, both input (emissions) and output files are accounted. It is worth noting that the amount of memory space for meteorology and air quality outputs depends almost linearly on the number of grid points (Tab. 1). Both meteorological and air quality inputs/outputs are stored in netCDF format, by means of 2D and 3D variables, with a own different amount of specific memory per variable. This is precisely the reason why air quality storages do not exactly scale with the grid spacing. CPU times also grow almost linearly with the number of grid points for 20 km and 4 km resolution; despite the number of grid points changes little passing from 4 km to 1 km resolution, the considerable growth of CPU time, with respect to the 4 km run, is due to a smaller integration time, needed for guaranteeing reliable and convergent solutions. Even the appearance of new small-scale meteorological structures, arising as the grid space is reduced, may contribute to rise the CPU time. Figure 6. Effect of increased resolution on period-averaged ozone concentration pattern: 20 km (left), 4 km (center) and 1 km (right). Conclusions The verification of AMS-MINNI with data from the Trisaia field campaign showed good performances and confirmed that both the introduction of new modules and the increasing spatial resolution substantially improved the model performances. Future verifications of AMS-MINNI in polluted areas, such as the Po Valley, will provide further indications on the strengths and shortcomings of the modelling system. The availability of ENEA-GRID computational resources has been crucial for achieving our purposes, because of the higher computational demand associated with both the model upgrades and the spatial resolution increase. Figure 3. CPU time (left axis) and space requirement (right axis) for meteorological simulations. Figure 4. CPU time (left axis) and space requirement (right axis ) for air quality simulations. References [1]Mircea M., Ciancarella L., Briganti G., Calori G., Cappelletti A., Cionni I., Costa M., Cremona G., D'Isidoro M., Finardi S., Pace G., Piersanti A., Righini A., Silibello C., Vitali L., Zanini G.,Assessment of the AMS-MINNI system capabilities to simulate air quality over Italy for the calendar year 2005. Atmospheric Environment, Volume 84, (2014), 178-188, ISSN 1352-2310. [2] Carter W.P.L.. Documentation of the SAPRC-99 chemical mechanism for VOC reactivity assessment. Final report to California Air Resources Board, Contract no. 92-329, and (in part) 95-308, (2000). [3] Guenther A., Karl T., Harley P., Wiedinmyer C., Palmer P. I., and Geron C. Estimates of global terrestrial isoprene emissions using MEGAN (Model of Emissions of Gases and Aerosols from Nature). atmos. chem. phys., 6, (2006) 3181-3210. [4]Madronich S. Photodissociation in the atmosphere 1. Actinic flux and the effects of ground reflections and clouds. J. Geophysical Research, 92, (1987) 9740–9752. [5] BRIGANTI G., CALORI G:, CAPPELLETTI A., CIANCARELLA L., D’ISIDORO M., FINARDI S., VITALI L. Determination of multi-year atmospheric transfer matrices for GAINS-Italy model. High Performance Computing on Cresco Infrastructure: research activities and results 2009-2010, (2011), ENEA, ISBN: 978-88-8286-242-8. Gino Briganti*, Andrea Cappelletti, Luisella Ciancarella, Giuseppe Cremona, Massimo D’Isidoro, Mihaela Mircea, Lina Vitali. ENEA UTVALAMB-AIR *Officialcontact: gino.briganti@enea.it