Download
1 / 29
340 likes | 589 Vues
OPTIMUM WATER MANAGEMENT ON SOYBEAN UNDER DEFICIT IRRIGATION (ダイズの節水栽培における最適灌漑法). RADEN ACHMAD BUSTOMI ROSADI. National consumption. 2.68. 2.02. production. 1.38. 0.71. import. 1.31. 1.30. (65 %). (48 %). ( in million tons). Background.

E N D
OPTIMUM WATER MANAGEMENT ON SOYBEAN UNDER DEFICIT IRRIGATION(ダイズの節水栽培における最適灌漑法) RADEN ACHMAD BUSTOMI ROSADI
National consumption 2.68 2.02 production 1.38 0.71 import 1.31 1.30 (65 %) (48 %) (in million tons) Background Soybean in Indonesia 1999 2004 Major problem of Soybean production : Availability of water (limiting factor) Implementing deficit irrigation: inevitable
Objective : • To determine the critical water content (c) and water stress coefficient (Ks) of soybean plant to obtain of optimum water management. • To investigate the influence of deficit irrigation at individual growth stages on yield of soybean, so that the irrigation schedule for the individual growth stages can be made to ensure optimum growth and production of soybean.
Lampung Province Bandarlampung INDONESIA MATERIAL AND METHOD Location of the experimental site Lampung University, Faculty of Agriculture 43 m above sea level Period: 2000, 2001, and 2003
2000, and 2003 experiments Water Deficit level TREATMENTS 0 FC Design experiment: Randomized block design, with 5 treatments and 4 replication WD1 (D1) 20 WD2 (D2) 40 WD3 (D3) Irrigation 60 WD4 (D4) 80 WD5 (D5) Daily 100 PWP D1 ---- D5 treatments For 2001 experiment % of TAW
The growth period of soybean 2 weeks before harvesting Irrigation was stopped DAT 85 0 15 28 42 70 Seedling Harvesting
air-dried soil Soybean seed Black plastic container (10L vol.) 7Kg air-dried soil
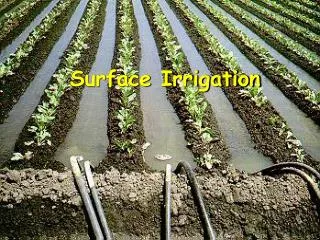
Evapotranspiration (ET) Transpiration (T) Gravimetric Method Handy can Soil water daily monitoring Irrigation = ET or T (previous day)
Agronomic variables evaluated: • plant height • leaf number • flower number and pod number • total biomasses • yield • Crop water requirement (CWR) • Water Use Efficiency (WUE) • Yield Efficiency (YE) Statistical analysis : }5 % level • F- test • Least Significant Different (LSD) test
1. Experiment period: June-sept 2000 The effect of WD on leaf number Leaf number (pieces) WD3 start to stress P= 0.5 c = 30.5 % (vol) Week
The ratio ETa/ ETm, and water stress coefficient (Ks) in Ultisol (p) = available water depletion fraction *) in stress condition Assume:The ET at WD1 was ETm Ks =ETa/ETm or ETc adj/ ETc (Allen,1998) The water stress coefficient (Ks) at WD3 (p=0.5) = 0.78
The effect of WD on WUE, and YE in Ultisol Optimum Yield WD3 conserve 10.1 % of water
Ky = 0.85 The relation between relative yield decrease (1-Ya/Ym) and relative evapotranspiration deficit (1-ETa/ETm) in Ultisol The Ky of soybean for the entire growing period of WD = 0.85
2. Experiment period: June –Sept 2003 The effect of WD on leaf area index Leaf area index (cm2) WD3 in stress c= 32.7 % (vol) WD5 in stress c= 28.4 % (vol) Week
The ratio Ta/ Tm, and water stress coefficient (Ks) in Andisol *) in stress condition WD4 = 0.52 WD5 = 0.38 The Ks average: WD2 = 0.82 WD3= 0.68
The effect of WD on the total biomass, yield, CWR, WUE, and YE in Andisol O p t i m u m yield WD3 conserve 24.6 % of water
Ky=0.507 Ky=1 The relation between relative yield decreased (1-Ya/Ym) and relative transpiration deficit (1-Ta/Tm) in Andisol The Ky of soybean for the entire growing period of WD = 0.507
3. Experiment period: August- October 2001 Crop Water Requirement P= 0.5 c = 26 % (vol)
The effect of available water deficit to the Ta/Tm at various growth stages in Ultisol
Yield No Stress Stress Condition Compared to WD2
Yield response to water deficit at the different growth stages in Ultisol
The relationship between the p and YE (g/g) at the different growth stages in Ultisol
CONCLUSION • The critical water content (c) of soybean: Ultisol = 30.5% (week IV) Andisol = 28.4 % (week V) 32.7% (week VI) 36.9% (week VIII) • The coefficient stress (Ks) of soybean: Ultisol = 0.78 Andisol = 0.82 (AW deficit 20-40%) 0.68 (AW deficit 40-60%) 0.52 (AW deficit 60-80%) 0.38 (AW deficit 80-100%) • The yield response factor (Ky) of soybean: Ultisol = 0.851 Andisol =0.507
The optimum yield of soybean: The deficit irrigation at 40-60% of AW deficit conserve of water Andisol: Ultisol : 24.6 % 10.1%
Sensitive to water stress c = 26 %
Thank you very much Arigatou gozaimasu