Download
1 / 1
20 likes | 94 Vues
2306. Brückner et al., Fig. 3. v-type ATPase cluster. (1233933). (1274604). RupA. 1235210. 1261227. Brückner et al., Fig. 3. 5000. 10000. 15000. 20000. 25000. TIGR. sp1309. sp1310. sp1311. sp1312. sp1313-1. sp1313-2. sp1316. sp1317. sp1318. sp1320. sp1321. sp1322. sp1324.

E N D
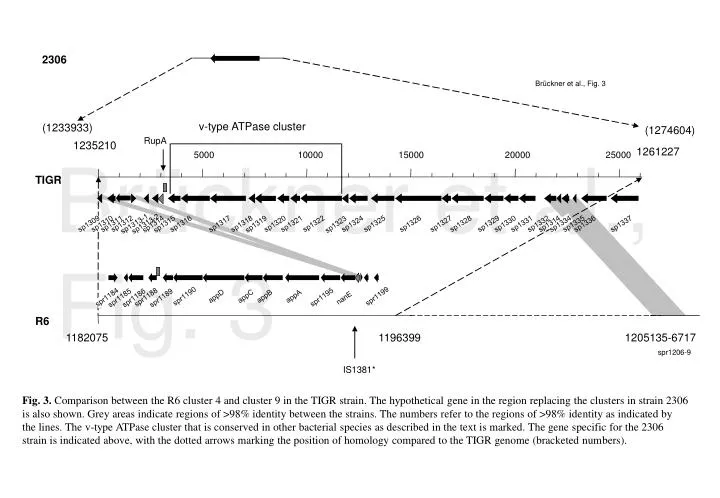
2306 Brückner et al., Fig. 3 v-type ATPase cluster (1233933) (1274604) RupA 1235210 1261227 Brückner et al., Fig. 3 5000 10000 15000 20000 25000 TIGR sp1309 sp1310 sp1311 sp1312 sp1313-1 sp1313-2 sp1316 sp1317 sp1318 sp1320 sp1321 sp1322 sp1324 sp1325 sp1326 sp1327 sp1328 sp1329 sp1330 sp1331 sp1332 sp1314 sp1334 sp1335 sp1336 sp1337 sp1314 sp1315 sp1319 sp1323 spr1190 appD appC appB appA spr1199 spr1184 spr1188 spr1195 spr1185 spr1186 spr1189 nanE R6 1182075 1196399 1205135-6717 spr1206-9 IS1381* Fig. 3. Comparison between the R6 cluster 4 and cluster 9 in the TIGR strain. The hypothetical gene in the region replacing the clusters in strain 2306 is also shown. Grey areas indicate regions of >98% identity between the strains. The numbers refer to the regions of >98% identity as indicated by the lines. The v-type ATPase cluster that is conserved in other bacterial species as described in the text is marked. The gene specific for the 2306 strain is indicated above, with the dotted arrows marking the position of homology compared to the TIGR genome (bracketed numbers).