Download
1 / 33
340 likes | 470 Vues
Association mapping: finding genetic variants for common traits & diseases. Manuel Ferreira. Genetic Epidemiology. Queensland Institute of Medical Research Brisbane. WEHI Postgraduate seminar, 31 May 2010. Why?. Understand disease aetiology.

E N D
Association mapping: finding genetic variants for common traits & diseases Manuel Ferreira Genetic Epidemiology Queensland Institute of Medical Research Brisbane WEHI Postgraduate seminar, 31 May 2010
Why? Understand disease aetiology Predict disease risk / drug response Personalized Medicine Lancet 2010; 375: 1525–35
Rare, monogenic traits Ng et al. Nature Genetics 2010; 42: 30-35.
GENETICS OF COMMON DISEASES Phenotypic modelling 1990 Linkage analysis Association analysis 2000 2005 2008 2009 2010 2015
Recent advances assays/analysis genetic variation HapMap, 1000 Genomes High-throughput genotyping & sequencing Analytic Methods Genome-wide association, imputation, stratification, CNVs, risk prediction genes
HapMap project 1. GOALS “The HapMap was designed to determine the frequencies and patterns of association among roughly 3 million common Single Nucleotide Polymorphisms (SNPs) in four populations, for use in genetic association studies.” [4] Individuals SNPs [1] The International HapMap Consortium. Nature 2003; 426: 789. [2] International HapMap Consortium. Nature 2005; 437: 1299. [3] International HapMap Consortium. Nature 2007; 449: 851. [4] Manolio et al. J Clin Invest 2008; 118: 1590.
HapMap project 2. STRATEGY Genome-wide SNP discovery 1,7 million dbSNP 9,2 million 14,7 million (6,5 million validated) 2002 2005 2009 SNP selection Phase 1: MAF>0.05, validated, non-synonymous SNPs prioritised (1,27 million total) Genotyping 7 genotyping platforms used/developed by 12 centres 30 trios Yoruba in Ibadan, Nigeria (YRI) 30 trios European descent in Utah (CEU) 45 unrelated Han Chinese from Beijing (CHB) 45 unrelated Japanese from Tokyo (JPT) Phases 2 and 3 expanded SNP (4 million) and population (11) coverage http://www.hapmap.org/
HapMap project 3. OUTCOMES “Systematic” catalogue of common human variation Designing and refining high-throughput genotyping platforms Population genetics (selection, sub-structure, recombination & mutation) Linkage disequilibrium (LD) or correlation between SNPs (tagging, fine-mapping, imputation)
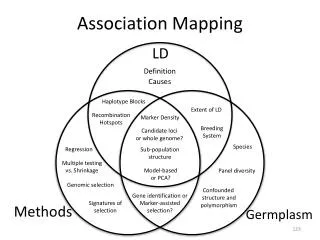
Gene A Correlation (LD) between SNPs D’ and r2 Haplotypes SNP tags Haploview, Tagger HapMap SNPs Genetic Coverage Proportion of known SNPs tagged Haploview eg. SNP 1 ‘tags’ 4/10 variants Fine-mapping Interesting SNPs to follow-up Cross-study comparisons
1000 Genomes project http://www.1000genomes.org/ GOAL “The 1000 Genomes Project aims to achieve a nearly complete catalog of common human genetic variants (defined as frequency 1% or higher) by generating high-quality sequence data for >85% of the genome for three sets of 400-500 individuals (...)” 2,500 samples at 4x by 2011
High-throughput genotyping & sequencing Whole-genome genotyping (from $300 USD/sample) Affymetrix: Illumina: 6.0 chip Human1M BeadChip >900,000 SNPs CNV probes 82% coverage CEU HapMap Accuracy 99.90% >1 million SNPs CNV probes 95% coverage CEU HapMap Accuracy 99.94% Whole-genome sequencing (from $10,000 USD/sample) Complete Genomics Illumina: HiSeq 2000 40x coverage 35 bp read length 30x coverage 100 bp read length
Recent advances assays/analysis genetic variation HapMap, 1000 Genomes High-throughput genotyping & sequencing Analytic Methods Genome-wide Association, stratification, imputation, CNV, risk prediction Examples: recent GWAS.
Analytic methods 1. GENOME-WIDE ASSOCIATION SNPs cases Individuals controls
Analytic methods Study designs Association tests Software Unrelated individuals Families Between individual effects Between + Within family effects Many (eg. PLINK) Merlin, etc Pros More power / $ spent, easier to collect, analyse Assess inheritance (CNVs), robust population stratification Unrelated individuals Families
Analytic methods 2. POPULATION STRATIFICATION Genetic matching A B A B
Analytic methods 3. IMPUTATION OF UNMEASURED GENOTYPES Genotyped Dataset SNPs Individuals Reference panel (eg. HapMap) Genotyped + Imputed Dataset Shaun Purcell, Doug Ruderfer (PLINK) MACH, IMPUTE, BEAGLE
Combine data from studies genotyped using different platforms
Example 1: Bipolar Disorder GWAS 325,690 SNPs >1,7 million SNPs Ferreira et al (2008) Nature Genetics 40: 1056
ANK3: Ankyrin G Cases: 7.0% Controls: 5.3% Odds ratio = 1.45 Not related to sex, psychosis or age-of-onset Replicated recently Smith et al (2009) Mol Psychiatry 14: 755-63. Scott et al (2009) Proc NatlAcadSci USA 106: 7501-6. [Lee et al (2010) Mol Psychiatry Apr 13 – Han Chinese population]
Example 2: analysis of lymphocyte subsets 2,538 individuals | CD4+ T cell levels, CD8+ T cell levels, CD4:CD8 ratio MHC class I • rs2524054, C • Increased CD8+ T levels • Improved host control of HIV (OR=0.32, P=10-9) MHC class II • rs9270986, A • Increased CD4+ T levels • Protective effect for type-1 diabetes (OR = 0.04, P=10-125) • Protective effect Rheum. Arthritis (OR=0.60, P=10-15) Ferreira et al. (2010) Am J Hum Genet 86: 88-92
Analytic methods 4. Structural Variants Deletions Duplications Insertions Quantitative (Copy Number Variants) Structural Variants Positional(Translocations) Orientational(Inversions) Genomic alterations involving segment of DNA >1kb
Detection of CNVs Non-polymorphic probes McCarroll et al 2008 Nat Genet 40: 1166
Detection of CNVs Use polymorphic probes from genotyping arrays to Identify and genotype new, potentially rarer CNVs Example: rs1006737 A/G probe 1 ... AGCCCGAAATGTTTTCAGA... probe 2 AA AG GG ... AGCCCGAAGTGTTTTCAGA... Intensity of probe 1 Intensity of probe 2
A/G Detection of CNVs A Copy number for: Genotype Ind Pattern Mat/Pat A G Total 1 A/G 1 1 2 2 A/- 1 0 1 3 AA/- 2 0 2 4 -/G 0 1 1 5 -/- 0 0 0 6 AAA/G 3 1 4 A G A A A G A A A G
A/G Detection of CNVs A Individuals with duplication(s) G/G Normalized intensity of allele G ie. total CN > 2 A/G A/A Normalized intensity of allele A Individuals with deletion(s) Polymorphic probe in CNV region ie. total CN < 2
Detection of CNVs Birdseye Affy 5.0, 6.0 Korn et al 2008 Nat Genet 40: 1253 PennCNV Affymetrix and Illumina Wang et al 2007 Genome Res 17: 1665 Combine information across probes to identify new CNVs
Example 3: Autism whole-genome CNV analysis COPPER Birdseye CNAT del dup Deletion frequency Iceland inherited 2 6 de novo 10 1 unknown 1 4 Autism 1% Psychiatric disorder 0.1% General population 0.01% Weiss et al. N Engl J Med 2008; 358: 667
Example 4: SCZ whole-genome CNV analysis Specific loci Genome-wide burden Cases Chromosome → Controls Shaun Purcell
Rate of non-genic CNVs in cases versus controls 1.09-fold increase P = 0.16 Rate of genic CNVsin cases versus controls 1.18-fold increase P = 5×10⁻⁶ Genome-wide burden of rare CNVs in SCZ 3,391 patients with SCZ, 3,181 controls Filter for <1% MAF, >100kb 6,753 CNVs Cases have greater rate of CNVs than controls 1.15-fold increase P = 3×10⁻⁵ Results invariant to obvious statistical controls Array type, genotyping plate, sample collection site, mean probe intensity Shaun Purcell
Crohn’s Disease (31 loci, ~10% variance) Jan 2006 to Jan 2008 30 20 N confirmed loci 10 0 before Jan 2006 5 http://www.genome.gov/gwastudies Altshuler, Daly & Lander. Science 2008; 322: 881 Manolio, Brooks & Collins. J Clin Invest 2008 118: 1590
Summary Tremendous recent technological advances Large-scale genetic association studies feasible >150 disease loci unequivocally identified since 2006 Provide a solid base to build our knowledge about disease mechanisms Hundreds of loci yet to be identified for most diseases