Download
1 / 1

E N D
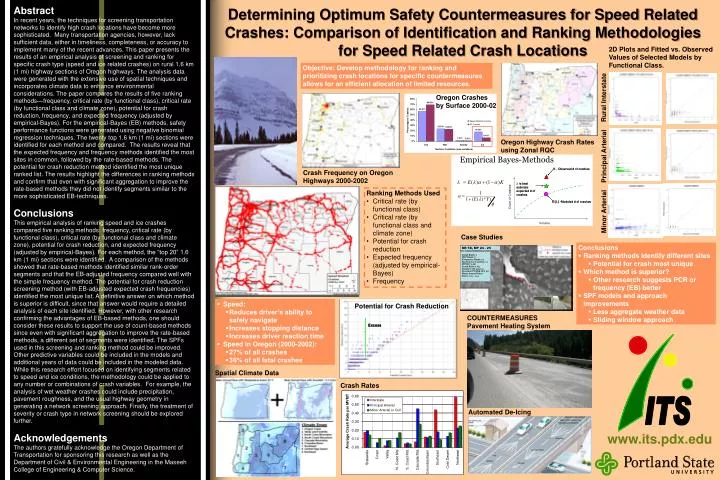
Abstract In recent years, the techniques for screening transportation networks to identify high crash locations have become more sophisticated. Many transportation agencies, however, lack sufficient data, either in timeliness, completeness, or accuracy to implement many of the recent advances. This paper presents the results of an empirical analysis of screening and ranking for specific crash type (speed and ice related crashes) on rural 1.6 km (1 mi) highway sections of Oregon highways. The analysis data were generated with the extensive use of spatial techniques and incorporates climate data to enhance environmental considerations. The paper compares the results of five ranking methods—frequency, critical rate (by functional class), critical rate (by functional class and climate zone), potential for crash reduction, frequency, and expected frequency (adjusted by empirical-Bayes). For the empirical-Bayes (EB) methods, safety performance functions were generated using negative binomial regression techniques. The twenty top 1.6 km (1 mi) sections were identified for each method and compared. The results reveal that the expected frequency and frequency methods identified the most sites in common, followed by the rate-based methods. The potential for crash reduction method identified the most unique ranked list. The results highlight the differences in ranking methods and confirm that even with significant aggregation to improve the rate-based methods they did not identify segments similar to the more sophisticated EB-techniques. Conclusions This empirical analysis of ranking speed and ice crashes compared five ranking methods: frequency, critical rate (by functional class), critical rate (by functional class and climate zone), potential for crash reduction, and expected frequency (adjusted by empirical-Bayes). For each method, the “top 20” 1.6 km (1 mi) sections were identified. A comparison of the methods showed that rate-based methods identified similar rank-order segments and that the EB-adjusted frequency compared well with the simple frequency method. The potential for crash reduction screening method (with EB-adjusted expected crash frequencies) identified the most unique list. A definitive answer on which method is superior is difficult, since that answer would require a detailed analysis of each site identified. However, with other research confirming the advantages of EB-based methods, one should consider these results to support the use of count-based methods since even with significant aggregation to improve the rate-based methods, a different set of segments were identified. The SPFs used in this screening and ranking method could be improved. Other predictive variables could be included in the models and additional years of data could be included in the modeled data. While this research effort focused on identifying segments related to speed and ice conditions, the methodology could be applied to any number or combinations of crash variables. For example, the analysis of wet weather crashes could include precipitation, pavement roughness, and the usual highway geometry in generating a network screening approach. Finally, the treatment of severity or crash type in network screening should be explored further. Acknowledgements The authors gratefully acknowledge the Oregon Department of Transportation for sponsoring this research as well as the Department of Civil & Environmental Engineering in the Maseeh College of Engineering & Computer Science. Determining Optimum Safety Countermeasures for Speed Related Crashes: Comparison of Identification and Ranking Methodologies for Speed Related Crash Locations 2D Plots and Fitted vs. Observed Values of Selected Models by Functional Class. Empirical Comparison of German and U.S. Traffic Sensor Data and Impact on Driver Assistance Systems Steven Hansen and Dr. Robert L. Bertini, Portland State University Objective: Develop methodology for ranking and prioritizing crash locations for specific countermeasures allows for an efficient allocation of limited resources. Oregon Crashes by Surface 2000-02 Rural Interstate Oregon Highway Crash Rates using Zonal RQC Principal Arterial Crash Frequency on Oregon Highways 2000-2002 Steve Hansen, Dr. Robert Bertini, Portland State University • Ranking Methods Used • Critical rate (by functional class) • Critical rate (by functional class and climate zone) • Potential for crash reduction • Expected frequency (adjusted by empirical-Bayes) • Frequency Minor Arterial Case Studies • Conclusions • Ranking methods identify different sites • Potential for crash most unique • Which method is superior? • Other research suggests PCR or frequency (EB) better • SPF models and approach improvements • Less aggregate weather data • Sliding window approach • Speed: • Reduces driver’s ability to safely navigate • Increases stopping distance • Increases driver reaction time • Speed in Oregon (2000-2002): • 27% of all crashes • 36% of all fatal crashes Potential for Crash Reduction COUNTERMEASURES Pavement Heating System Spatial Climate Data Crash Rates Automated De-Icing www.its.pdx.edu www.its.pdx.edu