Download
1 / 1
10 likes | 108 Vues
Identifying amplifying African waves from analysis of their temperature anomalies: how can the NAMMA aircraft, radiosonde and satellite data be merged to get a sufficiently useful product? Michael W. Douglas 1 and John F. Mejia 2

E N D
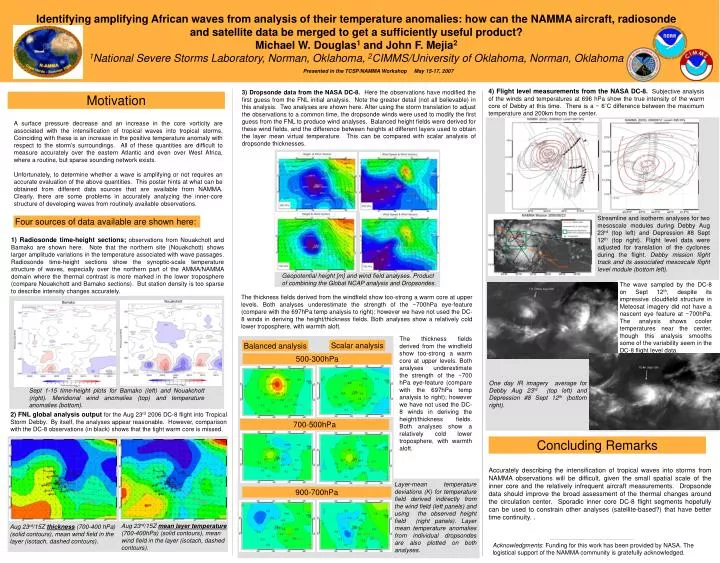
Identifying amplifying African waves from analysis of their temperature anomalies: how can the NAMMA aircraft, radiosonde and satellite data be merged to get a sufficiently useful product? Michael W. Douglas1 and John F. Mejia2 1National Severe Storms Laboratory, Norman, Oklahoma, 2CIMMS/University of Oklahoma, Norman, Oklahoma Presented in the TCSP/NAMMA Workshop May 15-17, 2007 4) Flight level measurements from the NASA DC-8. Subjective analysis of the winds and temperatures at 696 hPa show the true intensity of the warm core of Debby at this time. There is a ~ 6˚C difference between the maximum temperature and 200km from the center. 3) Dropsonde data from the NASA DC-8. Here the observations have modified the first guess from the FNL initial analysis. Note the greater detail (not all believable) in this analysis. Two analyses are shown here. After using the storm translation to adjust the observations to a common time, the dropsonde winds were used to modify the first guess from the FNL to produce wind analyses. Balanced height fields were derived for these wind fields, and the difference between heights at different layers used to obtain the layer mean virtual temperature. This can be compared with scalar analysis of dropsonde thicknesses. Motivation A surface pressure decrease and an increase in the core vorticity are associated with the intensification of tropical waves into tropical storms. Coinciding with these is an increase in the positive temperature anomaly with respect to the storm’s surroundings. All of these quantities are difficult to measure accurately over the eastern Atlantic and even over West Africa, where a routine, but sparse sounding network exists. Unfortunately, to determine whether a wave is amplifying or not requires an accurate evaluation of the above quantities. This poster hints at what can be obtained from different data sources that are available from NAMMA. Clearly, there are some problems in accurately analyzing the inner-core structure of developing waves from routinely available observations. Streamline and isotherm analyses for two mesoscale modules during Debby Aug 23rd (top left) and Depression #8 Sept 12th (top right). Flight level data were adjusted for translation of the cyclones during the flight. Debby mission flight track and its associated mesoscale flight level module (bottom left). Four sources of data available are shown here: 1) Radiosonde time-height sections; observations from Nouakchott and Bamako are shown here. Note that the northern site (Nouakchott) shows larger amplitude variations in the temperature associated with wave passages. Radiosonde time-height sections show the synoptic-scale temperature structure of waves, especially over the northern part of the AMMA/NAMMA domain where the thermal contrast is more marked in the lower troposphere (compare Nouakchott and Bamako sections). But station density is too sparse to describe intensity changes accurately. Geopotential height [m] and wind field analyses. Product of combining the Global NCAP analysis and Dropsondes. The wave sampled by the DC-8 on Sept 12th, despite its impressive cloudfield structure in Meteosat imagery did not have a nascent eye feature at ~700hPa. The analysis shows cooler temperatures near the center, though this analysis smooths some of the variability seem in the DC-8 flight level data. The thickness fields derived from the windfield show too-strong a warm core at upper levels. Both analyses underestimate the strength of the ~700hPa eye-feature (compare with the 697hPa temp analysis to right); however we have not used the DC-8 winds in deriving the height/thickness fields. Both analyses show a relatively cold lower troposphere, with warmth aloft. The thickness fields derived from the windfield show too-strong a warm core at upper levels. Both analyses underestimate the strength of the ~700 hPa eye-feature (compare with the 697hPa temp analysis to right); however we have not used the DC-8 winds in deriving the height/thickness fields. Both analyses show a relatively cold lower troposphere, with warmth aloft. Scalar analysis Balanced analysis 500-300hPa One day IR imagery average for Debby Aug 23rd (top left) and Depression #8 Sept 12th (bottom right). Sept 1-15 time-height plots for Bamako (left) and Nouakchott (right). Meridional wind anomalies (top) and temperature anomalies (bottom). 2) FNL global analysis output for the Aug 23rd 2006 DC-8 flight into Tropical Storm Debby. By itself, the analyses appear reasonable. However, comparison with the DC-8 observations (in black) shows that the tight warm core is missed. 700-500hPa Concluding Remarks Accurately describing the intensification of tropical waves into storms from NAMMA observations will be difficult, given the small spatial scale of the inner core and the relatively infrequent aircraft measurements. Dropsonde data should improve the broad assessment of the thermal changes around the circulation center. Sporadic inner core DC-8 flight segments hopefully can be used to constrain other analyses (satellite-based?) that have better time continuity. . Layer-mean temperature deviations (K) for temperature field derived indirectly from the wind field (left panels) and using the observed height field (right panels). Layer mean temperature anomalies from individual dropsondes are also plotted on both analyses. 900-700hPa Aug 23rd/15Z mean layer temperature (700-400hPa) (solid contours), mean wind field in the layer (isotach, dashed contours). Aug 23rd/15Z thickness (700-400 hPa) (solid contours), mean wind field in the layer (isotach, dashed contours). Acknowledgments: Funding for this work has been provided by NASA. The logistical support of the NAMMA community is gratefully acknowledged.