Download
1 / 22
220 likes | 335 Vues
Data Team Protocol and OARS For Secondary Schools. Your name here. This Guide will: Show you how to use OARS for DATA ANALYSIS Show you how to Find Test Results in OARS for Data Meetings Show you how to Generate Reports for Use in Data Team Meetings

E N D
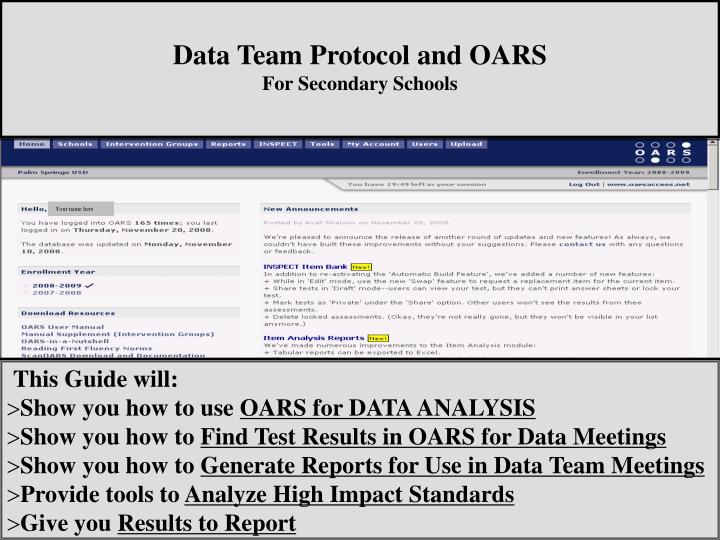
Data Team Protocol and OARS For Secondary Schools Your name here • This Guide will: • Show you how to use OARS for DATA ANALYSIS • Show you how to Find Test Results in OARS for Data Meetings • Show you how to Generate Reports for Use in Data Team Meetings • Provide tools to Analyze High Impact Standards • Give you Results to Report
Data Team Protocol steps in this guide: • Data Gathering by Class/Student (pp. 3-13) (preparing for Data Team Meeting) • Which Standards should I focus on? (pp. 8 & 11) • What are common distractor patterns? (pp. 12-13) With this you should be able to meet with your data team and decide on an essential standard. • Data Analysis (Step #2), which will assist with: • Define specific problem (Step #3) (pp. 8-13) • Identify cause (Step #4) (pp. 12-13) • Quantify current proficiencies for all students (pg. 10) • Quantify current proficiencies for EL’s (pp. 14-23) • Using Demographic Filter on Item Analysis Report (pp. 14-16) • Using CELDT levels from student roster (pp. 17-18) • Using Multiple Measures Report (pp. 19-23) This will give you, and your team, data to fill in the Data Analysis Worksheet. • *Short Cycle Exam Creation is Covered in a Separate Document From OARS to Data Team Success! For Secondary Only 2 2 2
First Step: Opening • Data Gathering by Class/Student (preparing for Data Team Meeting) • Log on to OARS • Select your class • In the Drop Down Box shown, select your subject area, and, • Click GO We’re now in a 7th Grade Math class. They have taken Benchmark 1. (7th Grade Math is used for demonstration purposes in this guide.) 3
On the prior page we clicked on the REPORTS Tab to get to this screen. Selecting this from the drop down will give us Math results Now click on Class Report 4
This screen will appear, make sure its your class then click “All Students” Name Then this report will appear in a separate screen 5
Print this report for your Data Team Meeting, to be used during Data Analysis (Step #2) On the report click on “Percent Answering Correctly”… …and the report is re-ordered…print this report for your Data Team Meeting Name If you can’t see the shaded areas when printing, go to the home page on OARS, open the OARS USER MANUAL (lower left of page) and follow the instructions beginning on page 31. 6
FBB BB Basic Proficient Advanced NEW Performance Band Proficiency Defaults – Elementary and Secondary (% Correct) Below 35% 35% - 50.99% 51% - 68.99% 69% - 85.99% 86% - 100% Name For Data Analysis (Step 2) and Wrong Answer Analysis (Steps 2 & 4) Looks like we have some opportunities! Now let’s look at this by Standards instead of By Item. Click here. 7
Lots of Info: • Standard Number • Description of Standard • # of Questions on the test • “Proficiency” I’m going to click on Detail Reports by Standard, it looks like something I could use. 8
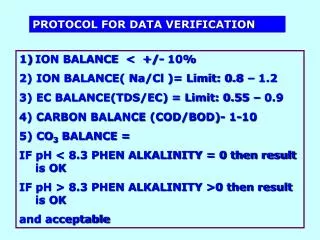
FBB BB Basic Proficient Advanced Below 35% 35% - 50.99% 51% - 68.99% 69% - 85.99% 86% - 100% NEW Performance Band Proficiency Defaults – Elementary and Secondary (% Correct) I’m seeing what I need, but it’s a bit hard to sort through. I’d like to see my lowest to highest percentages. Click here to resort by student performance 9
FBB BB Basic Proficient Advanced Below 35% 35% - 50.99% 51% - 68.99% 69% - 85.99% 86% - 100% Print this report for your Data Team Meeting For Secondary Only Now I have what I need to fill out the Collect Data Table 10
Look at the bottom of this report. This info will help you select high impact standards with low student performance Look at the bottom of this report. This info will help you select high impact standards with low student performance 11
And to prepare for Wrong Answer Analysis, click Detail Report – By Item, and this report will appear. And to prepare for Wrong Answer Analysis, click Detail Report – By Item, and this report will appear. Clicking here (# or % Correct) will sort in rank order for you. 12
Print this report for your Data Team Meeting Note-to view “all” click here And click any question to see student responses And click any question to see student responses 13
Second Step: Data Analysis with EL Focus There are multiple ways to get the data for EL’s Step 2--here’s one—Close the Item Analysis Report (prior slide)—then you’ll see the screen shown below. But what about this section? For Secondary Only Click on Filter Demographics—this will allow you to create a report with only your EL students. The next slide will show you how 14 14
Click % Correct to sort your EL scores—now you can easily identify the number of EL Students by Proficiency Levels • Use Language Proficiency drop down box , select English Learners and click Create Report • Then (on the Report that is generated) Click Detail Reports by Standard and this report will show. 15
For Secondary Only But what about these sections? And here is the information you need. You may want to print this report to bring to your meeting. Use this Report to count EL students by Proficiency Level and fill in your Data Worksheet 15 16
Here’s another way to get the EL information. Close the Item Analysis Report and return to class roster (by clicking on the Students tab at the top of the screen). In the “View” drop down—click on 2008 – 2009 CELDT. Go to the next slide to see results 17
Print this report to use as a reference while viewing test results And here are the CELDT levels for all of your students. Click on “Overall” to sort by CELDT level. 18
And here is yet another way to get the EL information (NOTE: only available for Benchmark Exams or Item Bank created tests*) Select Reports Under Multiple Measures Report--Click Create Class Report • You can click the red “X” to remove items you don’t want. • What you want to include in the report: • First and Last Name • CELDT Level • Assessment Results (as shown • on the next slide) *Note: If you create an Answer Key in OARS using the Tools/Test Key Editor feature (called “Teacher Created Tests”) these reports will not be available. 19
REMEMBER, if you administered a test using only an OARS created answer key (without questions from the Item Bank) you cannot use this method to view results! This menu will appear when you click Choose Local Assessments . Select your subject area—and that section will expand to show all courses in that subject area. Don’t forget to click Add after you make your selection(s) Once you choose your course (7th Gr. Math for this example), click the bar at the bottom of the menu screen called Populate Local Assessments and Close This Window. All assessments from the course will appear in the open window and you can pick the one you want (Highlight selection and Click ADD) . 20
This same method is also used for tests created using the INSPECT ITEM BANK, Click on Choose INSPECT Test; select “Tests I Created” or Shared Tests (if your Team Member created a test and shared it with you) and then click the “Populate” bar 21
Shown here are some of the Local Assessments and INSPECT Item Bank Tests. Scroll to bottom of report and select View HTML This report will appear. Click here to sort by CELDT level or Click here to sort by test performance Excel Wizard? Click here to download into an Excel Report! 22