Download
1 / 1
10 likes | 91 Vues
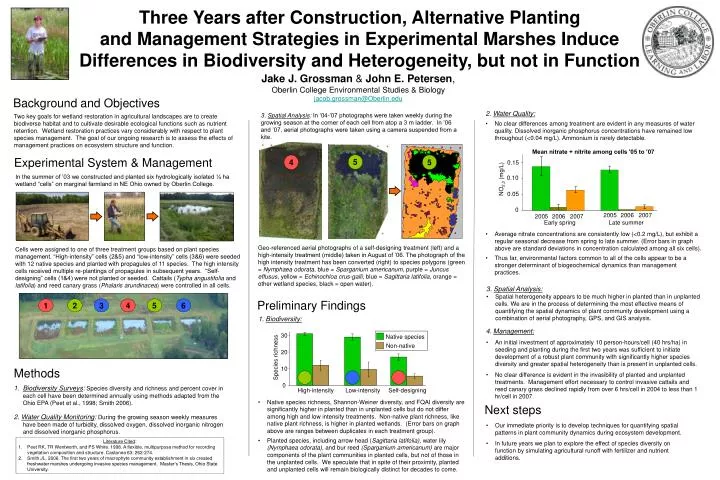
Mean nitrate + nitrite among cells '05 to ’07. 2005. 2005. 2006. 2006. 2007. 2007. NO 2,3 (mg/L). 0.15. 0.10. Early spring. Late summer. 0.05. 0. 30. Native species. 1. 2. 3. 4. 5. 6. Non-native. 20. Species richness. 10. 0. High-intensity. Low-intensity.

E N D
Mean nitrate + nitrite among cells '05 to ’07 2005 2005 2006 2006 2007 2007 NO2,3 (mg/L) 0.15 0.10 Early spring Late summer 0.05 0 30 Native species 1 2 3 4 5 6 Non-native 20 Species richness 10 0 High-intensity Low-intensity Self-designing Three Years after Construction, Alternative Planting and Management Strategies in Experimental Marshes Induce Differences in Biodiversity and Heterogeneity, but not in Function Jake J. Grossman & John E. Petersen,Oberlin College Environmental Studies & Biology jacob.grossman@Oberlin.edu Background and Objectives • 2. Water Quality: • No clear differences among treatment are evident in any measures of water quality. Dissolved inorganic phosphorus concentrations have remained low throughout (<0.04 mg/L). Ammonium is rarely detectable. • Average nitrate concentrations are consistently low (<0.2 mg/L), but exhibit a regular seasonal decrease from spring to late summer. (Error bars in graph above are standard deviations in concentration calculated among all six cells). • Thus far, environmental factors common to all of the cells appear to be a stronger determinant of biogeochemical dynamics than management practices. 3. Spatial Analysis: In ’04-’07 photographs were taken weekly during the growing season at the corner of each cell from atop a 3 m ladder. In ’06 and ’07, aerial photographs were taken using a camera suspended from a kite. Two key goals for wetland restoration in agricultural landscapes are to create biodiverse habitat and to cultivate desirable ecological functions such as nutrient retention. Wetland restoration practices vary considerably with respect to plant species management. The goal of our ongoing research is to assess the effects of management practices on ecosystem structure and function. Experimental System & Management 5 4 5 In the summer of ’03 we constructed and planted six hydrologically isolated ¼ ha wetland “cells” on marginal farmland in NE Ohio owned by Oberlin College. Geo-referenced aerial photographs of a self-designing treatment (left) and a high-intensity treatment (middle) taken in August of ’06. The photograph of the high intensity treatment has been converted (right) to species polygons (green = Nymphaea odorata, blue = Sparganium americanum, purple = Juncus effusus, yellow = Echinochloa crus-galli, blue = Sagittaria latifolia, orange = other wetland species, black = open water). Cells were assigned to one of three treatment groups based on plant species management. “High-intensity” cells (2&5) and “low-intensity” cells (3&6) were seeded with 12 native species and planted with propagules of 11 species. The high intensity cells received multiple re-plantings of propagules in subsequent years. “Self-designing” cells (1&4) were not planted or seeded. Cattails (Typhaangustifolia and latifolia) and reed canary grass (Phalaris arundinacea) were controlled in all cells. • 3. Spatial Analysis: • Spatial heterogeneity appears to be much higher in planted than in unplanted cells. We are in the process of determining the most effective means of quantifying the spatial dynamics of plant community development using a combination of aerial photography, GPS, and GIS analysis. Preliminary Findings 1. Biodiversity: • 4. Management: • An initial investment of approximately 10 person-hours/cell (40 hrs/ha) in seeding and planting during the first two years was sufficient to initiate development of a robust plant community with significantly higher species diversity and greater spatial heterogeneity than is present in unplanted cells. • No clear difference is evident in the invasibility of planted and unplanted treatments. Management effort necessary to control invasive cattails and reed canary grass declined rapidly from over 6 hrs/cell in 2004 to less than 1 hr/cell in 2007. Methods • Biodiversity Surveys: Species diversity and richness and percent cover in each cell have been determined annually using methods adapted from the Ohio EPA (Peet et al., 1998; Smith 2006). • 2. Water Quality Monitoring: During the growing season weekly measures have been made of turbidity, dissolved oxygen, dissolved inorganic nitrogen and dissolved inorganic phosphorus. • Native species richness, Shannon-Weiner diversity, and FQAI diversity are significantly higher in planted than in unplanted cells but do not differ among high and low intensity treatments. Non-native plant richness, like native plant richness, is higher in planted wetlands. (Error bars on graph above are ranges between duplicates in each treatment group). • Planted species, including arrow head (Sagittaria latifolia), water lily (Nymphaea odorata), andbur reed (Sparganium americanum) are major components of the plant communities in planted cells, but not of those in the unplanted cells. We speculate that in spite of their proximity, planted and unplanted cells will remain biologically distinct for decades to come. Next steps • Our immediate priority is to develop techniques for quantifying spatial patterns in plant community dynamics during ecosystem development. • In future years we plan to explore the effect of species diversity on function by simulating agricultural runoff with fertilizer and nutrient additions. • Literature Cited: • Peet RK, TR Wentworth, and PS White. 1998. A flexible, multipurpose method for recording vegetation composition and structure. Castanea 63: 262-274. • Smith JL. 2006. The first two years of macrophyte community establishment in six created freshwater marshes undergoing invasive species management. Master’s Thesis, Ohio State University.