Download
1 / 14
140 likes | 251 Vues
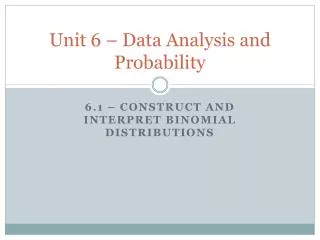
Unit 6 – Data Analysis and Probability. 6.1 – Construct and interpret binomial distributions . Georgia Performance Standards. MM3D1 – Students will create probability histograms of discrete random variables, using both experimental and theoretical probabilities. . Vocabulary.

E N D
Unit 6 – Data Analysis and Probability 6.1 – Construct and interpret binomial distributions
Georgia Performance Standards MM3D1 – Students will create probability histograms of discrete random variables, using both experimental and theoretical probabilities.
Vocabulary A random variable is a variable whose value is determined by the outcomes of a random event. A discrete random variable is a variable that can take on only a countable number of distinct values. A continuous random variable is a variable that can take on an uncountable, infinite number of possible values, often over a specified interval. A probability distribution is a function that gives the probability of each possible value of random variable. The sum of all the probabilities in a probability distribution must equal 1.
Vocabulary A binomial distribution shows the probabilities of the outcomes of a binomial experiment. A binomial experiment has n independent trials, with two possible outcomes (success or failure) for each trial. The probability for success is the same for each trial. The probability of exactly k success in n trials is P(k successes) = nCkpk(1-p)n-k Formula for success
Vocabulary A probability is symmetric if a vertical line can be drawn to divide the histogram of the distribution into two parts that are mirror images. A distribution that is not symmetric is called skewed.
Binomial Distribution Probability Distribution - symmetric Skewed Probability Distribution
Construct a Probability Distribution (Ex 1) Let X be a random variable that represents the number of questions that students guessed correctly on a quiz with three true-false questions. Make a table and a histogram showing the probability distribution for X.
Interpret a Probability Distribution (Ex 2) Use the probability distribution in Example 1 to find the probability that a student guesses at least two questions correctly. What are some things to consider??
Construct a binomial distribution (Ex 3) In a standard deck of cards, 25% are hearts. Suppose you choose a card at random, note whether it is a heart, then replace it. You conduct the experiment 5 times. Draw a histogram of the binomial distribution for your experiment. P(k successes) = nCkpk(1-p)n-k
Construct a binomial distribution (Ex 3) In a standard deck of cards, 25% are hearts. Suppose you choose a card at random, note whether it is a heart, then replace it. You conduct the experiment 5 times. Draw a histogram of the binomial distribution for your experiment. P(k=0)= 5C0(0.25)0(0.75)5 = 0.237 P(k=1)= 5C1(0.25)1(0.75)4 =0.396 P(k=2)= 5C2(0.25)2(0.75)3 = 0.264 P(k=3)= 5C3(0.25)3(0.75)2 =0.088 P(k=4)= 5C4(0.25)4(0.75)1 =0.016 P(k=5)= 5C5(0.25)5(0.75)0 =0.001
Construct a binomial distribution (Ex 4) According to a recent survey (It must be true if it’s in a PowerPoint), about 85% of the population at CHS love the show The Walking Dead. Suppose you ask 4 random students if they like the show The Walking Dead. Draw a histogram of the binomial distribution showing the probability that exactly k of the students like the show.
What can we learn from binomial distributions? What is the least likely outcome from the survey? What is the probability that k = 1? Describe the shape of the binomial distribution?