Download
1 / 81
810 likes | 982 Vues
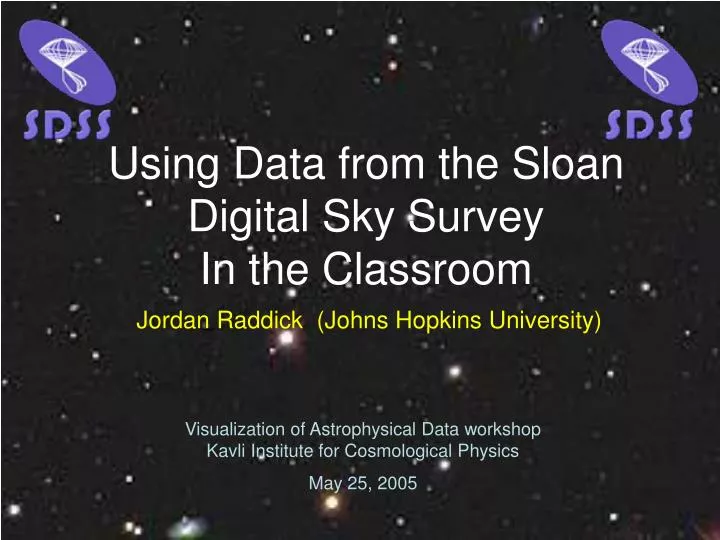
Using Data from the Sloan Digital Sky Survey In the Classroom. Jordan Raddick (Johns Hopkins University). Visualization of Astrophysical Data workshop Kavli Institute for Cosmological Physics May 25, 2005. Goals of the SDSS. Map sky down from ~9 th to ~23 rd magnitude

E N D
Using Data from the SloanDigital Sky Survey In the Classroom Jordan Raddick (Johns Hopkins University) Visualization of Astrophysical Data workshopKavli Institute for Cosmological Physics May 25, 2005
Goals of the SDSS • Map sky down from ~9thto ~23rd magnitude • Images in 5 color bands form 3800Å to 9200Å • Obtain spectra for 1 million galaxies and 100,000 quasars • Create a detailed 3Dmap of the universe
The Telescope • 2.5 meter F/5 reflector • Very wide (~3 degree) field of view • Alt-az mount • Drift scanning
The Spectrographs • Two fiber-fed spectrographs • Each can record 320 spectra simultaneously(640 total) • Determine redshifts, spectral types, chemical compositions
The Data of the SDSS Photometric Data Spectroscopic Data
Photometric Data • Tri-color images (g-r-i images) • FITS files (single-wavelength B/W images) • Magnitudes through each filter • Object type (star or galaxy) • Status (i.e. good seeing, cosmic rays, etc.) • Flags (i.e. saturated pixels, moving object, etc) • Photometric redshifts
Spectral Data • Moderate resolution (~1.3 Angstroms/pixel) from 3800 to 9200 Angstroms • GIF files with prominent lines marked • FITS files available • Detailed line widths and strengths
Online Access to the Data • All data will be made available online, free • New data added in six chunks • Currently Data Release 3 • Released October 2004
Introduction to SkyServer • Data Release 3 (DR3) • SkyServer • http://skyserver.sdss.org
Introduction to DR3 • ~5,200 square degrees • (Full moon is 0.25 square degrees) • Images of ~140 million objects • ~60 million stars • ~350,000 spectra • ~46,000 quasar spectra • Science quality data • Where in the sky?
DR3 Imaging Coverage (Aitoff projection of equitorial coordinates)
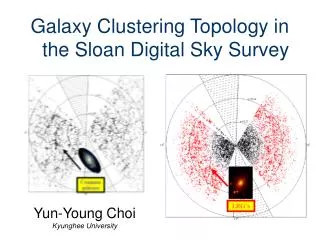
DR3 Spectral Coverage (Aitoff projection of equitorial coordinates)
SkyServer • A public interface toSDSS data • Servers donated byHewlett-Packard • Software, expertisedonated by Microsoft • Jim Gray, Curtis Wong
SkyServer • Funds from • NSF • STSci (IDEAS grant) • Maryland Space Grant • First light: 6/4/2001
Goals for SkyServer • Make high-quality astronomy data available to everyone • Create easy-to-use tools to access data • Allow amateurs to conduct professional-quality research • Promote the use of real science data in the classroom
SkyServer Tools • Simple tools for accessing data • Focus often on single objects • Prioritize information • First listed should be most important • Most tools are web service-based • Work should be done on server • Most written by A. Szalay et al at JHU
Example: Navigation tool Main window:Displays images Data Change RA/Dec Closeup DisplayOptions Controls
SkyServer Projects • Make the data useful in formal ed settings • Teach specific topics, tied to curriculum • Broader than just astronomy (e.g. spectra in chemistry) • Need clear logic for student to follow • Make it as easy as possible for teachers • Written by J. Raddick (science writer) and R. Sparks (high school teacher)
Example: Scavenger Hunt • Students go on a scavenger hunt of sky • Find stars, galaxies,quasars, meteor trails • Look for specificmagnitudes • Introduces students to SkyServer tools • Teaches night sky objects, quantitative reasoning
Scavenger Hunt Teacher Notes • Lesson Plan • Goals • Prerequisites • Vocabulary • Procedure • Background reading • Assessment • Sample solutions (password protected) • Rubrics
Scavenger Hunt Teacher Notes • Correlated to Teaching Standards • National Science Education Standards • AAAS Project 2061 • NCTM (Mathematics) • NETS Indicators (Technology Ed)
Current & Future Work • Combining SkyServer with other projects • Hands-On Universe for follow-up observations • NU Collaboratory for online mentoring and collaboration • Apply same design methods to National Virtual Observatory (NVO) education
Contact Information • Jordan Raddick(410) 516-8889raddick@pha.jhu.edu • http://skyserver.sdss.org
The rest of this presentation… • Is adapted from a SkyServer workshop from an AAPT meeting • Gives more detail about how to use SkyServer
Retrieving Data with SkyServer • Navigation Tool • Explore Tool • Get Spectra and Get Plates
Navigation Tool • Pan and zoom through the sky • Click on star/galaxy for summary of photo data • Online notebook to save objects • Create telescope finding charts
Object Explorer • Information on single objects • Photometric and spectroscopic • Look up by object ID, position, • Correlations to data from other sky surveys
Object Explorer • Search by – various methods to search for objects (ID, RA/Dec, Spectrum Nos.) • Summary – general photo and spectral info • PhotoObj – photometric data • Field – statistical data for a region of sky • Frame – JPEG images and their parameters • PhotoZ – photometric redshifts • Neighbors – list of objects within 0.5arcminutes • Navigate – link to Navigation tool • FITS – download raw images (FITS) continued
Object Explorer • SpecObj – measured parameters for a spectrum • SpecLine – information on individual lines • SpecLineIndex – line intensities used to find properties of galaxies • XCRedShift – Cross-correlation redshifts • ELRedShift – emission line redshifts • Spectrum – GIF of spectrum • Plate – information on plate that contains the spectrum • FITS – raw (FITS) file of the spectrum continued
Object Explorer • NED Search – searches for object in NASA Extragalactic Database (NED) • Virtual Sky – searches data at www.virtualsky.org • Save in Notes – saves object to online notebook • Show Notes – Shows objects in your notebook • Print Page – prints the current display
Getting Raw Images from Object Explorer • Click “PhotoObj -> FITS” • “Corrected Frames” are final images • One-wavelength, black/white • Zipped files • Extension .fts.gz • Use WinZip to extract single .fts file
Searching the Data • Radial Search • Rectangular Search • SQL Search • Schema Browser • Image List
Radial Search • Search around specified coordinates • Input ra, dec, radius • Can apply magnitude cuts for all five filters (optional) • Can retrieve data in HTML, XML, or CSV files • CSV files can be opened by most spreadsheet programs • 1,000 object limit continued
Radial Search • Example: search for Objects in galaxy cluster Abell 168 (from Famous Places)
Notes About the Results • ObjID, run, rerun, camcol, field and obj can be used to look up data in the Object Explorer or Get Fields • Obj Type: 3 = galaxy, 6 = star • Err_u, etc, are uncertainties in magnitudes
Rectangular Search • Similar to radial search • Search area is a rectangular box continued
Rectangular Search • Example : Search for objects near Abell 0957 • Select CSV for format continued
Rectangular Search (cont) • To save as a .csv file • Click the File menu and select “Save As” • Click “Save as type” and select text • Type a file name such as Abell0957.csv • Click Save continued
Rectangular Search To open a .csv file Use Excel’s “Text Import Wizard” • Open Excel • From the Data menu,select Get External Data ->Import Text File
Rectangular Search • Select “Delimited,” then “Comma” • Change anyobjid columns to“Text” • This preservesall 18 digits of Object IDs
SQL Search • What if you want to search for specific objects in the database? • Example: show me all bright blue galaxies • Database can return all bright blue galaxies and only bright blue galaxies! • How? SQL! • Incredibly powerful and flexible interface continued
SQL Search • SQL – Structured Query Language • Common database access language • Industry standard, so students have practical advantages to learning • Allows advanced searches (“queries”) of data • Search using constraints on any variable • Return any or all types of data
How to Learn SQL • Go to Help -> How-To -> Searching for Data • Interactive tutorial on SQL
Image List tool • Go to Tools -> Visual Tools -> Image List • Click “Use query to fill form” • Enter query andclick Submit
Image List tool • Results appear in window • Click “Send toList”
Image List tool • Thumbnail for each queryresult • Click any thumbnail to goto Navigation tool
Example: Stellar Evolution • Adapted from Projects -> Advanced -> H-R Diagram • How do stars change over time? • You can’t watch a star age • Stars live for billions of years! • So how can you learn?
Example: Stellar Evolution • Solution: study lots of stars • Large statistical sample • Stars at all stages of life • What properties to observe? • Temperature • Luminosity (brightness)
Temperature and Color • Stars emit thermal (“blackbody”) radiation • Hotter stars have ashorter peak wavelength • Shorter wavelength = bluer • How do you quantify “blueness”? A star with temperature 4000 K [peak wavelength in blue]