Download
1 / 35
350 likes | 467 Vues
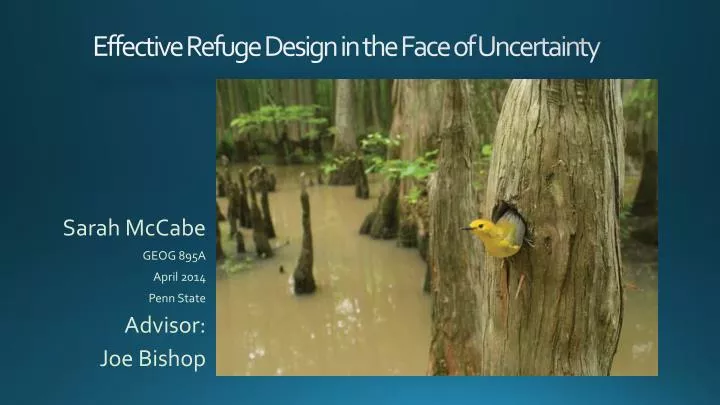
Sarah McCabe GEOG 895A April 2014 Penn State Advisor: Joe Bishop. Effective Refuge Design in the Face of Uncertainty. Topic : Migrating Songbirds Place: Texas Gulf Coast Project Question: Finding the best areas for a Refuge Identify the Criteria Identify Data

E N D
Sarah McCabe GEOG 895A April 2014 Penn State Advisor: Joe Bishop Effective Refuge Design in the Face of Uncertainty
Topic : Migrating Songbirds Place: Texas Gulf Coast Project Question: Finding the best areas for a Refuge Identify the Criteria Identify Data Part 1: Model the Criteria Part 2: Model the edges Part 3: Model Habitat Corridors Outline:
North American Migration
Migration – Hazards and Foraging habitat Hermit thrush
Radar Studies: Annually, 29 million individual birds, of 240 species, use the Gulf Coast. “Forested wetlands are used almost exclusively as important stopover areas and extensive pine flatlands are rarely used” (Gauthreaux, 2005). 1944 Image:http://virtual.clemson.edu/groups/birdrad/COM4D.HTM
Why are Wetland Forests Valuable for Migrating Birds? • Structure • Large and small trees, • Shrubs • Vines • High insect biomass
Why are Wetland Forests Valuable for Migrating Birds? Cape May Warbler and Northern Parula foraging for insects.
Columbia Bottomland Forest Forest Crops
The Columbia Bottomlands Original extent: 700,000 acres (US Fish and Wildlife Service, 2013)
The Columbia Bottomlands 1976: 305,914 acres 1996: 254,269 acres Reduction of 16% (Webb, 1996) Percent Canopy, 2001 National Land Cover Dataset
Causes of Clearing • Crops • Pasture • Ponds and reservoirs • Roads • Pipelines • Exurban development • Drainage canals
Edge distance: 100 meters from the forest boundary. Core forest and edge forest Core Edge
Forest Fragmentation – Why is it a problem? Decreased movement for some animals.Small, isolated habitat patches support fewer species.Conversion of core forest (deep shade) to edge forest (sunlight) favors different plant species.Decreased humidity reduces invertebrate numbers.Change in animal species.Large trees more vulnerable to wind.Increased access for predators and parasites.
Texas Parks and WildlifeUS Fish and Wildlife ServiceNatural Resources Conservation ServiceDucks UnlimitedGulf Coast Bird ObservatoryCradle of Texas Conservancy Austin’s Woods Conservation Plan Goal: Conserve 10% of original forest area, or 70,000 acres. Methods: Donation of fee title Conservation Easements Purchase of Fee title from willing sellers Initial Approval for 28,000 acres
Austin’s Woods Part II Further Approval for 42,000 acres to achieve goal of 70,000 acres.
Austin’s Woods Part II Further approval for 42,000 acres to achieve goal of 70,000 acres. What would be the ideal configuration of refuges, to select the most ecologically valuable areas, and to enhance the wildlife habitat conserved already? 42,000 acres
Austin’s Woods Project Land Protection Plan Priorities List Does the unit provide high quality old growth undisturbed habitat? Does the unit include exceptional/unique plant communities (e.g., canebrakes, willow swamps, bald cypress swamps, cherry laurel stands)? Is the size of tract greater than 1,200 acres, or does it have the potential to have adjacent lands conserved that would meet this criteria? Does the tract complement, is adjacent to or near other protected areas, particularly where natural links exist such as the same hydrologic system or seed dispersal corridors? Would acquisition maximize maintenance of natural ecological functions and processes (e.g., natural hydrological patterns)? Does the unit have a high degree of structural (plant community and topographic) complexity? Does the unit have great restoration potential with basic ecological processes; natural hydrological components, species presence intact and minimal invasive species? Does the unit influence hydrologic or watershed patterns?
Habitat Modelling: Approach 1: Literature Review and Expert Opinion-based Habitat Suitability Models • Similar to site location. • US Fish and Wildlife, Habitat Evaluation Procedures Handbook, 1981 Approach 2: Empirical and Statistical Techniques • Good data for species abundance or absence • Method: GIS habitat data is associated with species occurrence data. • More accurate, more costly.
Project Goal 1: Assess the Landscape for priority values, and identify the areas most highly rated. Objective 1 – Model each of the priorities using geographic data. Objective 2 – Weigh each of the factors and combine values to make a “Habitat Suitability Map” of Priority values. Objective 3 – Identify parcels with high Priority Values. Example: + + /Max =
Project Goal 1: Assess the Landscape for priority values, and identify the areas most highly rated. Example: Bobcat habitat suitability in Acadia National Park. Rohweder, 2012
Data Sets • County Tax Parcel Data Sets • Brazoria - Available online from Houston-Galveston Area Council • Fort Bend - Available on disk from County Offices • Also available online from Houston-Galveston Area Council • Matagorda - Data downloadable from their website • Wharton. - Available on disk in .dng format from County Offices • Infrastructure Data Sets • County Roads • Texas Railroads • Source: Houston-Galveston Area Council • Land Cover • National Land Cover Database 2011. • National Land Cover Database Tree Canopy 2011 • 2008 Land Cover Source: Houston-Galveston Area Council • Wetlands • National Wetlands Inventory • Water features • National Hydrography Data Set • Water Features. Source: Houston-Galveston Area Council • Vegetation • National Vegetation Classification – General Vegetation Classes • This data set has poor spatial resolution in this area • National Land Cover Data 2011 – Identifies Forested Wetland • Unique and Exceptional Plant Communities - Poll of local experts: Thomas Adams, Warren Pruess, Chris Kueper, David Rosen, Michael Lange. Survey form and on-line map. • Vegetation Complexity • US Basal Area-Weighted Canopy Heights 2000 (Woods Hole Research Center) • Topographic Complexity • National Elevation Data (NED) • Wharton County (30 meter grid) • Brazoria County (10 meter grid) • Matagorda County (10 meter grid) • Fort Bend County Lidar (in 50 foot grid) • Preserve Areas • Refuge Boundaries • Other protected areas: State Wildlife Management Areas, Mitigation Banks, Private Reserves – Source: Michael Lange, US FWS Biologist
Goal 1 Data Flow Chart
Project Goal 2: Assess vulnerability for conversion to edge forest. Linville Bayou Unit Objective 1 – Calculate Current core and edge forest on refuge parcels. Objective 2 – Model “brush removal” on refuge parcel exterior. Recalculate areas of core and edge forest. Objective 3 – Identify neighboring parcels with greatest impact Results – List of Parcels that would have a large impact on core forest if they were cleared. 1944 2011 Google Earth
Model travel corridorsfor Gulf Coast Box Turtle. Project Goal 3: Objective 1 – Identify habitat needs of juvenile Box Turtles (more likely to travel than adults). Objective 2 – Identify data sets to represent barriers, corridors, and quality habitat. Objective 3 – Model corridors with a Least Cost calculation. Result – A raster data set modelling the dispersal of juvenile Box Turtles. Small objects can be barriers for young box turtles.
Goal 3 – Corridor Design using cost distance Rohweder, 2012
What I have done so far: Identified most of the National , State and County sources of data. Identified Two Habitat Modelling examples to imitate Surprises/Concerns: Goal 1: Assess the Landscape for priority values: Counties vary widely in the availability and format for tax parcel data. The options are: Download Link, email for ftp permission, bring a big check for a CD. I need to keep a “Data Directory” spreadsheet so I know where the data is. Major To-Do’s: • Study and understand the modeling examples. • Acquire and review data • Keep another spreadsheet with processing steps.
What I have Done so Far: Data will be adapted from the Goal 1 project. Surprises/Concerns: Goal 2: Assess vulnerability for conversion to edge forest I want to identify the neighboring parcels that contribute the most to protecting the core forest. That list may need a lot of explanation Major To-Do’s: Data Processing should be simple.
What I have done so far: A literature search on Box Turtle habitat and movement. Surprises/Concerns: Texas Parks and Wildlife has a Box Turtle reporting system (They consider Box Turtles as threatened.) The data sets I am using may not have fine enough scale to be meaningful. I may make incorrect assumptions about how turtles behave. Goal 3: Model travel corridors for Gulf Coast Box Turtle Major To-Do’s: Choose data sets to model the habitat for young box turtles. Review the habitat and corridor modelling examples.
Identify: Areas of highest value for stop-over habitat for migratory birds A specific list of county tax parcels that include those areas Parcels that are valuable for the protection of core habitat on refuge parcels A corridor model for animals moving between existing refuge parcels. Results: Discussion: “Reconciliation ecology” – Improving a human-altered landscape for wildlife. Tax benefits and conservation easements - steps a private landowner would need to do to take advantage of any of these programs. Identifying parcels around the refuges to apply these programs to.
Week 1 – May 28 A. Collect any data I do not have already Week 2 – June 4 A. Model: Priority 1 Old-growth HabitatB. Priority 2: Contact Plant Experts, gather their input C. Priority 3: Identify large contiguous tracts from county parcels and Tax ID. D. Priority 4: Model Adjacency to large Tracts E. Priority 4: Identify Adjacent parcels that share water or wetland features. G. Priority 5a: Areas with Multi-story Plant Communities H. Priority 6. Topographic complexity I. Write about Priority modelling. Use illustrations and charts. Week 3 – June 11 A. Identify a rating system on the priorities.B. Calculate priorities as a heat mapC. Discuss rating with Mike Lange, Refuge Biologist, adjust weight values. D. Identify water features that control water level. Week 4 – June 25 A. Make List of large, priority parcelsB. Work on Core and Edge Forest calculationsC. Identify top acreage: Top 10K, 20K, Top 40K, Top 60K acres D. Write about Priority modelling. Use illustrations and charts a lot. Weeks 5 and 6– July 9B. Model habitat corridors for box turtles.C. Write about habitat modelling. Week 7-8 – July 23 A. Write Results sectionB. Write about “reconciliation ecology” and partnerships with private owners.C. Work on presentation. Week 9-10 July 30 A. Rewrite everythingB. Presentation. Schedule:
Northwest GIS Users Conference Oct 13-17, 2014 Lynnwood, WA Other Conferences: Society for Conservation GIS July 11-13, 2014 Monterey, CA Society for Conservation Biology (N America) July 13-17, 2014 Missoula, MT Southern Forestry and Natural Resource Management GIS Conference December 2014 Texas Wildlife Society Feb 19-22, 2015 Corpus Christi, TX Texas Land Conservation Conference:Mar 4-6, 2015 International Association of Landscape Ecology July 5-10, 2015 Portland Oregon. Conference:
References Clemson University, 2013. Web page. “Migrating Birds: TransgulfMigration”http://virtual.clemson.edu/groups/birdrad/COM4D.HTM Habitat Modelling, Corridordesign.org website, http://corridordesign.org/designing_corridors/habitat_modeling/ Accessed 4/28/2014 Gautreau, S.A. Jr. and Belser, C.A. (2005). Radar ornithology and the conservation of migratory birds. In: C. John Ralph and Terrell D. Rich, editors. 2005. Bird Conservation Implementation and Integration in the Americas: Proceedings of the Third International Partners in Flight Conference. 2002 March 20-24; Pp.871-875. http://virtual.clemson.edu/groups/birdrad/pubs/Gauthreaux_networks_9-2005.pdf Harris, L.D. 1984. The Fragmented Forest: Island Biogeography Theory and the Preservation of Biotic Diversity. University of Chicago Press, Illinois. Moore, F. R., Gauthreaux Jr, S. A., Kerlinger, P. A. U. L., & Simons, T. R. (1995). Habitat requirements during migration: important link in conservation.Ecology and management of neotropical migratory birds, a synthesis and review of critical issues (TE Martin and DM Finch, eds). Oxford University Press, New York, 121-144. Webb, J., 1996 (Unpublished). “Forest Habitats of Austin’s Woods of Texas” Gulf Coast Bird Observatory, Texas A&M University at Galveston. US Fish and Wildlife Service, 2013. Texas Mid‐Coast Refuge Complex Comprehensive Conservation Plan and Environmental Assessment. Appendix I, Land Protection Plan, pages 281 to 314. http://www.fws.gov/southwest/refuges/plan/docs/Texas/TMC_CCP_portfolio.pdf Accessed 03/08/2014. US Fish and Wildlife Service, 1981, Habitat Evaluation Procedures Handbook. http://www.fws.gov/policy/esmindex.htmlAccessed 4/28/2014