Download
1 / 17
170 likes | 266 Vues
Diagnostic Data Acquisition for the Laser Beam at FNPL. *. * Fermi Northern Illinois Center for Accelerator and Detector Development. Michelle Alvarado Supervisor: Jamie Santucci. University of Illinois at Urbana-Champaign Senior, Engineering Physics. Outline. I. FNPL’s Role at Fermi

E N D
DiagnosticData Acquisition for the Laser Beam at FNPL * * Fermi Northern Illinois Center for Accelerator and Detector Development Michelle Alvarado Supervisor: Jamie Santucci University of Illinois at Urbana-Champaign Senior, Engineering Physics
Outline I. FNPL’s Role at Fermi II. Layout of the Laboratory III. Overview of Project IV. Instruments CWAC OSA V. Conclusion
FNPL’s Role at Fermi • Previous Research • Tesla Project in Germany • Current Research • Accelerator Science Research: • plasma wake-field acceleration • channeling radiation • beam physics • Future Objectives • Prototype Injector for International Linear Collider (ILC). • Dark matter • Dark Energy • Extra Dimensions • Fundamental nature of matter, energy, space and time
Layout of FNPL * UV laser * Cs2 Te cathode in L-band RF-Gun * Superconducting TESLA cavity
Aø Laser Room • Seed Laser – Beam source • Pulse picker -- picks part of beam to follow its path or sends rest to diagnostic table • Beam is amplified • Second phase—The infrared light’s wavelength is changed to green and then to ultraviolet light.
Previous Work • Jamie Santucci created LabView programs • Motivation • Fermilab stops supporting Macintosh computers and PC’s are the ones being used • Laser Room is rebuilt—need more Data acquisition systems • Programs need to be transferred and upgraded
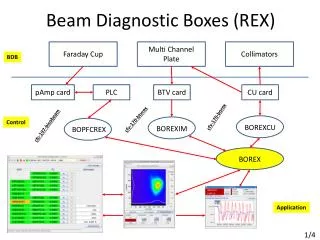
FWHM=0.187 ms 5.6 ps pulse length Optical Spectrum Analyzer Auto-correlation Previous Data Acquisition Print-out obtained from the CWAC. Photographed waveform of OSA screen Previous information was impractically obtained and difficult to catalogue.
Tasks GPIB connection Or Remote Control CWAC & OSA • To transfer Labview programs from the old Macintosh computers to PC’s. • To modify and upgrade previously created program. • To create a data acquisition systems to catalogue and analyze data from the beam. • To analyze the information obtained from the newly modified and created programs. Data & Files
Optical Spectrum Analyzer The FWHM of the trace from the OSA is the bandwidth of the laser. • The x –axis is the wavelength. • The y-axis is the amplitude. LabView obtained waveform from the OSA.
Results for OSA FWHM is obtained because it is a fundamental point of comparison for stability of laser beam over time. Excel obtained graph for the OSA. For the FWHM graph over time we look for consistency over time. Excel obtained FWHM data for the OSA.
Continuous Wave Auto-Correlator (CWAC) • Measures the pulse width in the time domain. • Two split infrared beams are correlated onto a crystal • Convoluted green beam results • The x-axis is the pulse length. • The y-axis is the amplitude.
Results for CWAC Excel graph of analyzed data obtained from the Continuous Wave Auto-Correlator The waveform we get from the CWAC is the result of the convolution of the two infrared beams. Convolution Or more explicitly: Where F(t) is the waveform we get from the CWAC and I(t) is the original Infrared waveform.
If we assume green beam is of Gaussian form then: FWHMCWAC=FWHMIR Results for CWAC
Conclusion • The seed laser is the key part of the entire laser system • A more practical and efficient method for diagnostic data acquisition were completed • Categorized pulse in • time domain with the CWAC • frequency domain with the OSA • Data acquired give us conveniently acquired information about the stability of the seed laser.
Acknowledgements • Supervisors and mentors Jamie Santucci & Jianliang Li • Elliott MacCrory, Dianne Engram, Dr. Davenport and SIST committee members • Eugene Lorman and Bob Flora for their technical support • Everyone at Aø Laboratory
DiagnosticData Acquisition for the Laser Beam at FNPL Questions? Michelle Alvarado Supervisor: Jamie Santucci University of Illinois at Urbana-Champaign