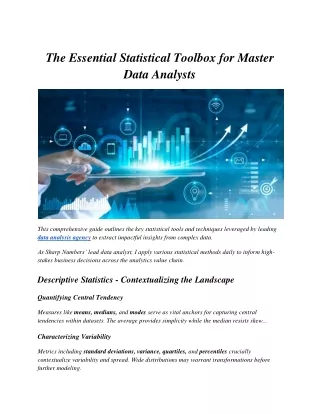
The Essential Statistical Toolbox for Master Data Analysts
Linear regression models estimate mathematical relationships and dynamics between independent variables/predictors and a dependent outcome variable.

The Essential Statistical Toolbox for Master Data Analysts
E N D
Presentation Transcript
The Essential Statistical Toolbox for Master Data Analysts This comprehensive guide outlines the key statistical tools and techniques leveraged by leading data analysis agency to extract impactful insights from complex data. As Sharp Numbers’ lead data analyst, I apply various statistical methods daily to inform high- stakes business decisions across the analytics value chain. Descriptive Statistics - Contextualizing the Landscape Quantifying Central Tendency Measures like means, medians, and modes serve as vital anchors for capturing central tendencies within datasets. The average provides simplicity while the median resists skew... Characterizing Variability Metrics including standard deviations, variance, quartiles, and percentiles crucially contextualize variability and spread. Wide distributions may warrant transformations before further modeling.
Visualizing Distributions Histograms, boxplots, heatmaps, and scatterplots provide visualization mechanisms to surface trends, clusters, correlations, and outliers across data dimensions. Graphical exploratory analysis guides statistical testing... Mastering descriptive statistics enables sound preliminary analysis to surface patterns, anomalies, and preliminary takeaways. Hypothesis Testing - The Scientific Method Statistical Significance Calculating probabilities and P-values facilitates formally testing hypotheses by establishing result significance. Analysts set alpha levels to quantify tolerances and the likelihood of errors. A/B Testing A/B testing digital content relies heavily on hypothesis testing to determine if one version meaningfully outperforms another. The scientific method is the engine behind data-driven experimentation and optimization... Correlation Analysis - Quantifying Relationships Pearson’s Correlation Coefficient The Pearson correlation coefficient (r) measures the linear relationship between variables on a -1 to 1 scale. Strong positive correlations imply variables move in tandem while strongly negative values indicate inverse ties... Limits of Correlation Confounding factors coupled with the maxim "correlation does not imply causation" establish limits when inferring drivers from the correlation analysis. Isolating causal mechanisms may require controlled experiments... Pinpointing correlated relationships aids analysts in identifying predictive opportunities within datasets.
Regression Analysis - Modeling Predictive Relationships Quantifying Variable Relationships Linear regression models estimate mathematical relationships and dynamics between independent variables/predictors and a dependent outcome variable. Regression coefficients quantify the directional impact of each driver on the predicted variable... Optimization and Evaluation Tuning procedures like k-fold cross-validation coupled with key metrics such as R-squared, and Mean Absolute Error inform model fitness. Techniques like regularization help improve generalizability and prevent overfitting... Regressions enable accurate forecasting and predictions powering everything from financial projections to predictive sales analytics Segmentation - Grouping Similar Data Points Partitioning Data K-means clustering, hierarchical clustering and other segmentation algorithms group data points into distinct clusters based on similarity. Proper segmentation partitions population heterogeneity... Developing Customer Personas Marketing teams leverage segmentation to carve out unique buyer personas based on demographics, behaviors, and attributes. Cluster analysis aids in developing customized messaging and experiences...
Future-Proofing with Machine Learning As data complexity and scale accelerate, analytics requires AI/ML fluency for extracting insights. Neural networks, deep learning, and related techniques "learn" intricate data patterns and drive informed business decisions. While statistics provide the indispensable backbone, integrating machine learning future-proofs skillsets on the cutting edge of data science. This versatile statistical toolbox empowers analysts to conquer multifaceted data challenges with strategic precision, leading organizations to game-changing insights.