Enhancing SQL Access for Health Data Insights Using Toad: A Step-by-Step Guide
This guide walks you through the process of utilizing Toad for Data Analysts to analyze health data from the CHSI Dataset. You'll learn to connect to an Excel workbook, execute SQL queries to extract important demographic and health information, and visualize poverty rates and life expectancy on a state level. Key steps include filtering and joining tables while ensuring data accuracy and clarity. Whether you're new to Toad or seeking to refine your SQL skills, this resource is tailored for data analysts focusing on community health metrics.

Enhancing SQL Access for Health Data Insights Using Toad: A Step-by-Step Guide
E N D
Presentation Transcript
Using Toad for Data Analysts A prettier SQL interface
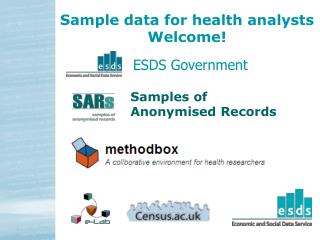
Step 1: Get to know your data • Excel Workbook titled “CHSI Dataset” • Community Health Status Indicators • Downloaded from Data.gov • DataElementDescription = Data Dictionary • DefinedDataValue = Data Code sheet • Additional tables provide various health measures, often on the county level
Import Data • Select all data in Workbook, save and close • Navigation Manager Create new connection Group: Excel Advanced Uncheck Read-Only & Automatically create ranges Navigate to CHSI Data.xls Name: CHSI
Data Browser • Double-click on table DATAELEMENTDESCRIPTION • FilterWhere Clause: Page_Name = ‘Demographics’
SQL Editor • Click Editor • Input: • Select * from DATAELEMENTDESCRIPTION descr where descr.PAGE_NAME = ‘Demographics’ • Don’t forget to name your table by typing in a nickname after full table name. This simplifies query writing
Join tables • Let’s join Demographics to Summary Measures of Health • What are common fields? • State_FIPS_Code • County_FIPS_Code • select demo.CHSI_County_Name, demo.poverty, summ.ALE from DEMOGRAPHICS demo, SUMMARYMEASURESOFHEALTH summ where demo.CHSI_State_Abbr='CA' and summ.State_FIPS_Code=demo.State_FIPS_Code and summ.County_FIPS_Code=demo.County_FIPS_Code • This will tell us percent living below 10th Percentile average life expectancy per county
Grouping Data • What if we want to know poverty rates and average life expectancy by state? • select demo.CHSI_State_Abbr, sum(demo.poverty), avg(summ.ALE) from DEMOGRAPHICS demo, SUMMARYMEASURESOFHEALTH summ where summ.State_FIPS_Code=demo.State_FIPS_Code and summ.County_FIPS_Code=demo.County_FIPS_Code group by demo.CHSI_State_Abbr
Sorting Data • Now let’s sort the states by number in poverty, highest to lowest • You can simply click on output header and sort • Or use the following code: • select * from (select demo.CHSI_State_Abbr, sum(demo.poverty), avg(summ.ALE) from DEMOGRAPHICS demo, SUMMARYMEASURESOFHEALTH summ where summ.State_FIPS_Code=demo.State_FIPS_Code and summ.County_FIPS_Code=demo.County_FIPS_Code group by demo.CHSI_State_Abbr) order by Expr1001 asc