Draw a Venn Diagram
170 likes | 1.21k Vues
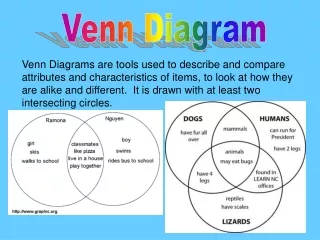
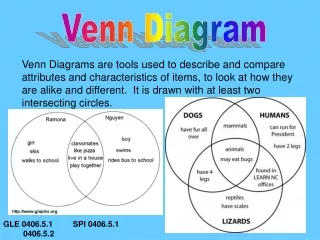
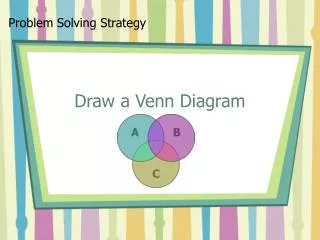
Draw a Venn Diagram. Problem Solving Strategy. Draw a Venn Diagram. Another way to visually organize information is to create a Venn diagram.

Draw a Venn Diagram
E N D
Presentation Transcript
Draw a Venn Diagram Problem Solving Strategy
Draw a Venn Diagram • Another way to visually organize information is to create a Venn diagram. • Venn diagrams are excellent ways to sort data into categories that have overlapping characteristics. They clearly show relationships between categories.
Draw a Venn Diagram • When creating a Venn diagram, you can use any shapes to house your information like circles, rectangles, triangles, loops, or anything else that clearly relates the connections between data. • When a category is completely inside another it is a subset of the larger category like the city of Bloomington’s circle would be completely in a circle marked Illinois since all of Bloomington is in Illinois.
Draw a Venn Diagram • If circles intersect, then the categories have something they share. For instance, if one circle is the basketball team and one is the football team, students who are on both would be placed in the intersected area and students only on the basketball team would be it its circle while students only on the football team would be in the football circle.
Draw a Venn Diagram • When circles don’t intersect, then it shows that categories don’t share any of the characteristics being looked at. For instance, geographically, Illinois and Florida don’t share any land and would be represented by two circles that don’t touch each other but they both could be placed in a bigger circle called the United States (set of all the states). Illinois and Florida would be considered subsets of the set of all the states.
Draw a Venn Diagram • You can’t use Venn diagrams on many problems but when you’re looking for relationships between data, they are a very effective tool and often can shed some new information when used in combination with another problem solving strategy.
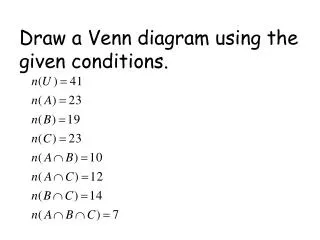
How many students? In a poll of 46 students, 23 liked rap music, 24 liked rock music, and 19 liked country music. Of all the students, 12 liked rap and country, 13 liked rap and rock, and 14 liked country and rock. Of those students, 9 liked all three types of music. How many students did not like any of these types?
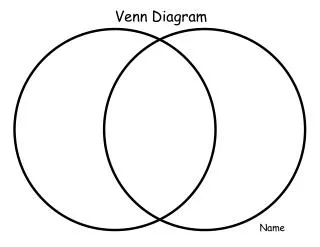
Draw shapes for each of the categories Notice that the shapes should overlap in this problem! Problem: In a poll of 46 students, 23 liked rap music, 24 liked rock music, and 19 liked country music. Of all the students, 12 liked rap and country, 13 liked rap and rock, and 14 liked country and rock. Of those students, 9 liked all three types of music. How many students did not like any of these types?
Fill loops from the inside out! Problem:In a poll of 46 students, 23 liked rap music (9+3+4+7), 24 liked rock music (9+4+5+6), and 19 liked country music (9+3+5+2) . Of all the students, 12 liked rap and country (9+3), 13 liked rap and rock (9+4), and 14 liked country and rock (9+5). Of those students, 9 liked all three types of music. How many students did not like any of these types? 7 4 6 9 3 5 2
Fill in the region outside the loops Problem:In a poll of 46 students, 23 liked rap music, 24 liked rock music, and 19 liked country music. Of all the students, 12 liked rap and country, 13 liked rap and rock, and 14 liked country and rock. Of those students, 9 liked all three types of music. How many students did not like any of these types? 7 4 6 9 3 5 2 10 46 – (7+4+6+3+9+5+2) =
Check the calculations 7 + 4 + 6 + 3 + 9 + 5 + 2 + 10 = ? 7 4 6 9 46 It Works! 3 5 2 10
Strategy: Draw a Venn Diagram • Draw overlapping loops for intersecting sets. • Fill regions from the inside out. • Subtract carefully. • After regions are filled, see what number answers the question. • Check the calculations.
Now it’s your turn… • Open your problem solving book and go to the section on Draw a Venn Diagram (pages 29-30). • Print off a problem solving sheet and do a complete solution to a problem from this section…do one and submit it or do more for “extra fun”. (Children Dancers, Music Survey and/or The Flu and You) • Email your complete solution, with your steps clearly shown to NCAMath@district87.org or put them in Nancy Powell’s mail box! • Have fun and Problem Solve!