
Uploaded by
olympia-baxter
1 SLIDES
157 VUES
20LIKES
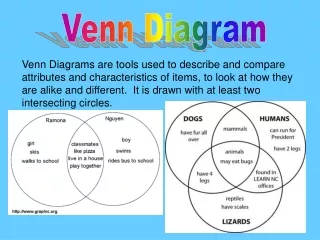
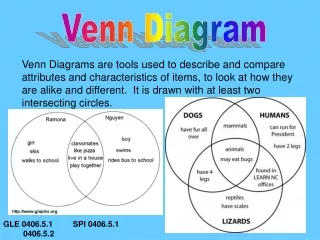
Understanding Venn Diagrams: Visualizing Relationships and Set Intersections
DESCRIPTION
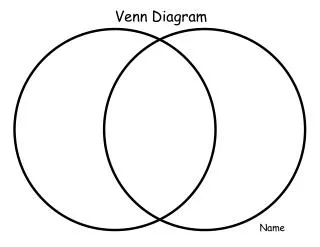
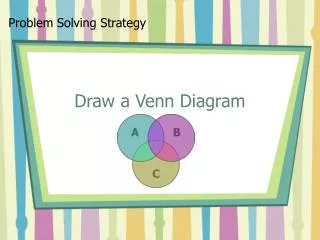
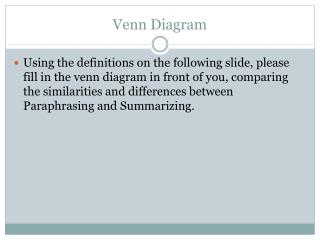
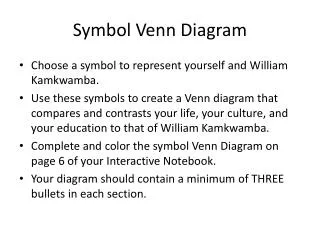
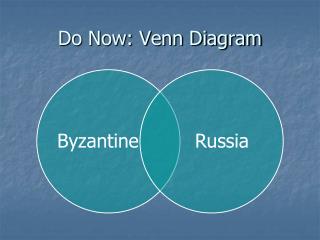
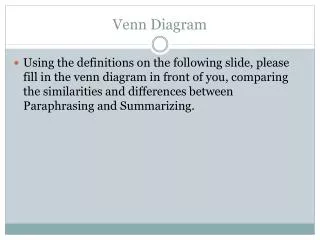
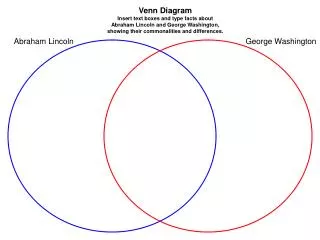
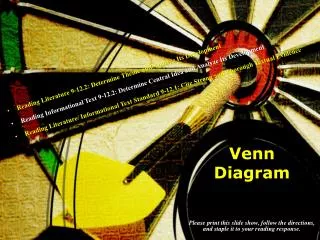
Venn diagrams are powerful tools for visualizing relationships between different sets. They use overlapping circles to illustrate how sets intersect, are distinct, or share common elements. This method aids in the comprehension of logical relationships, probability, and various mathematical concepts. Whether for educational purposes, data analysis, or decision-making processes, Venn diagrams simplify complex ideas and enhance understanding. Discover how to effectively create and interpret Venn diagrams for your projects, presentations, or studies.
Download
1 / 1
Télécharger la présentation 
Understanding Venn Diagrams: Visualizing Relationships and Set Intersections
An Image/Link below is provided (as is) to download presentation
Download Policy: Content on the Website is provided to you AS IS for your information and personal use and may not be sold / licensed / shared on other websites without getting consent from its author.
Content is provided to you AS IS for your information and personal use only.
Download presentation by click this link.
While downloading, if for some reason you are not able to download a presentation, the publisher may have deleted the file from their server.
During download, if you can't get a presentation, the file might be deleted by the publisher.
E N D


More Related
Audio
Live Player