Venn Diagram
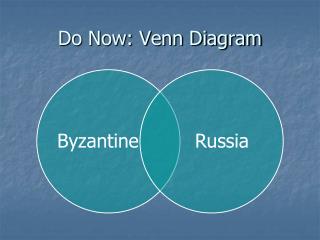
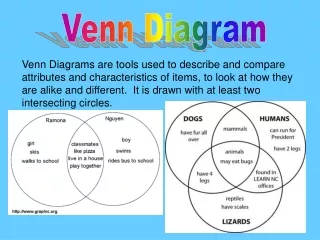
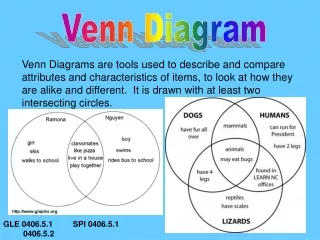
Venn Diagram. Venn Diagram Explained. Allows you to find similarities and differences between two things being compared. First, choose two things to be compared. Second, draw two overlapping circles. Similarities. Differences. Differences.

Venn Diagram
E N D
Presentation Transcript
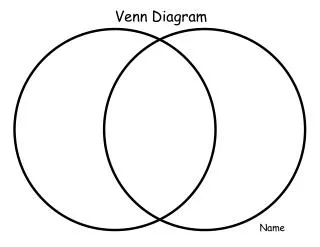
Venn Diagram Explained • Allows you to find similarities and differences between two things being compared. • First, choose two things to be compared • Second, draw two overlapping circles Similarities Differences Differences • Third, label the outer part of the circles “Differences” and the inner part of the circles “Similarities”
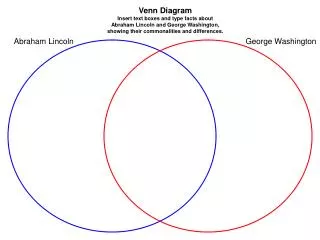
On the left, outer circle, for Subject A, in ten words or less, write three things different from Subject B Making Comparisons • On the right, outer circle, for Subject B, in ten words or less, write three things different from Subject A • Finally, in the overlapping area of the two circles, in ten words or less write three things Subject A and Subject B have in common Name of Subject A Name of Subject B List 3 Similarities 1. 2. 3. List 3 Differences 1. 2. 3. List 3 Differences 1. 2. 3. • Third, Label the outer part of the circles “Differences” and the inner part of the circle “Similarities” • Lastly, add a picture or graphic that symbolizes each of the three areas of the overlapping circles.
Venn Diagram Example Abraham Lincoln 1. Kennedy was elected to the presidency in 1960 1. Wife lost a child while living in the White House 2. Kennedy shot in a Lincoln, made by Ford 3. Kennedy's successor was Lyndon Johnson, born in 1908 1. Lincoln was elected to the presidency in 1860 2. Shot in the back of head in presence of wife 2.Lincoln shot in the Ford Theater 3. Directly concerned with Civil Rights 3. Lincoln's successor was Andrew Johnson, born in 1808 John F. Kennedy
Grade ScaleBloom’s Scale Evaluating Your Work • No Errors = 5/A Evaluation • One Error = 4/B Analysis • Two Errors = 3/C Comprehension • Three Errors = 2/WH Knowledge • Four or More Errors = 1/PK Pre-Knowledge • First, write one sentence explaining what you did well according to the skill being learned using the language of Bloom’s taxonomy. Creativity • Then, write one more sentence explaining what you could do better or differently next time and how you could move up one level on Bloom’s Taxonomy.
1. On the tool bar, click on “File,” click on “Print.” 2. In the “Print” dialogue box, in the lower left corner under “Print What,” click on the drop down arrow and select “Handouts.” 3. Then, under “Color/Grayscale,” select the best on for your printer. 4. Next, under “Handouts,” click on “Slides per Page,” and choose “9.” Printing Directions 5. Lastly, click on “OK,” and the file will print.