Download
1 / 43
440 likes | 731 Vues
Chapter 1 - Motion. 1 .1 Describing Motion. I. Essential Question:. When is an object in motion?. II. Key Vocabulary. Motion: if an object’s position changes relative to another object. Position: an object’s location

E N D
Chapter 1 - Motion 1.1 Describing Motion
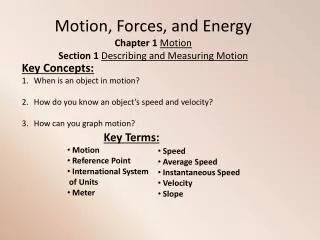
I. Essential Question: • When is an object in motion?
II. Key Vocabulary • Motion:if an object’s position changes relative to another object. • Position: an object’s location • Reference point: a place or object used for comparison to detect movement. • Distance: the length of the path between two points.
III. Key Concepts • An object is in motion if it changes position relative to a reference point. • Reference points need to be non-moving. • Motion depends on the reference point • In two exact situations, motion CAN or CANNOT be detected based on the reference point.
III. Key Concepts • We measure distance in meters. • 1 km = 1,000 m • 1 m = 100 cm • 1 m = 1,000 mm
IV. Exploration • Create a chart in your science notebook similar to the one below:
IV. Exploration • Materials: meter stick, pencil, and science notebook. • Procedures: • 1. Identify 6 objects in the classroom. Choose objects of different sizes. • 2. Use the meter stick to measure each object. Use a metric unit (example: cm). • 3. Record each object’s length in the chart you made. • 4. Return your meter stick to the counter. • 5. Convert each object’s measurement into m, cm, and mm.
V. Understanding and Applying • Answer the following questions in your science notebook: • Why do you think it is useful to have different units of measurement? • How do you think measuring objects relates to the topic of motion? How does it relate to finding an object’s speed?
Chapter 1 - Motion 1.2 Speed
I. Essential Question: • How do you calculate speed?
II. Key Vocabulary • Speed: the distance an object moves per unit time. • Average speed: the total distance divided by the total time. • Instantaneous speed: the speed of an object at a given instant in time.
III. Key Concepts • Speed if a rate that can be calculated by dividing the distance an object moves by the time it takes to move. • Speed = distance / time • The standard unit for speed is meters per second, or m/s.
III. Key Concepts • Speed can change during a race of trip, but an average speed can be found. • Having a greater average speed compared to instantaneous speed will finish first.
IV. Exploration • Make a chart similar to the one below.
IV. Exploration • Make a chart similar to the one below.
IV. Exploration • Question: How can we measure speed? • Materials: Stopwatch, pencil, and science notebook. • Procedures: • 1. We will all go outside as a class. • 2. Once outside, I will divide you into teams of 3. • 3. Two people will stand at the start line, and one person (with the stopwatch) will stand at the finish line.
IV. Exploration • Procedures: • 4. The first person will take their turn running (or walking) from the start line to the finish line. The other person at the start line will say “Go”, telling the runner and the timer to begin. The runner will say “stop”, telling the timer when to stop. Record the time. • 5. Do this process again with the second person. • 6. Have the timer give the stopwatch to a team member that has already run. Repeat the process with the timer as a runner. • 7. After your team has finished running and recording your times, you need to find the average speed for each team. • Do this by adding up the three times, and then dividing by 3.
IV. Exploration • Procedures: • 8. Find each runner’s speed, and record it in the chart. • Do this by dividing your distance (20 m) by your time. • 9. Find each team’s average speed, and record it in the chart. • Do this by adding the three speeds and dividing the total by 3.
V. Understanding and Applying • Why is it more important to look at the average speed for a race than the instantaneous speed? • How did you calculate speed in the lab today? • What connection could you make between a runner’s time and a runner’s speed?
Chapter 1 - Motion 1.2 Velocity
I. Essential Question: • What is velocity?
II. Key Vocabulary • Velocity: speed in a particular direction • Vector: a quantity having size and direction
III. Key Concepts • Motion depends on speed and direction. • When both of these are known, you know velocity. • North, East, South, and West are example of direction. • Velocity is a vector.
IV. Exploration • See Marble Races worksheet.
V. Understanding and Applying • See Marble Races Worksheet
Chapter 1 - Motion 1.2 Graphing Motion
I. Essential Question: • How can we show motion on a graph?
II. Key Vocabulary • Slope: the steepness of a line on a graph. • X-axis: the horizontal line on a graph • Y-axis: the vertical line on a graph
III. Key Concepts • To show motion, compare distance (y-axis) to time (x-axis). • Slope tells how fast or slow an object is moving. • More steep means faster speed.
III. Key Concepts • Find slope by dividing the rise (change up or down) by the run (change left to right). • Different slopes give us clues to changes in speed.
IV. Exploration • See Marble Races worksheet for data. • You are going to make a total of 6 graphs using this chart. • First, graph the three times you got for each ramp height. You should have a separate graph for each height, with three lines per graph. • Then, graph the average times you got for all of the ramp heights. You should have one graph with 5 lines. • Make sure to include a title, labels, and correct data. Lines should be neatly made – use a ruler if you need to! I should also be able to tell what each line represents.
Chapter 1 - Motion 1.3 Acceleration
I. Essential Question: • What is acceleration?
II. Key Vocabulary • Acceleration: the rate at which an object’s velocity changes.
III. Key Concepts • Any change of speed or direction is an example of acceleration. • Negative acceleration, or slowing down, is sometimes called deceleration.
III. Key Concepts • To calculate acceleration, take the final speed and subtract the initial speed. Then, divide this by your time. • We measure acceleration in meters per second squared, or m/s2.
IV. Exploration • See Speed/Acceleration Lab worksheet.
V. Understanding and Applying • See Speed/Acceleration Lab worksheet.
Chapter 1 - Motion 1.3 Graphing Acceleration
I. Essential Question: • How can you graph acceleration?
II. Key Vocabulary • See prior notes on graphing.
III. Key Concepts • A speed vs. time graph shows acceleration; a distance vs. speed graph shows speed. • Lines going up in the graph show a positive acceleration • Lines going down in the graph show a negative acceleration • Horizontal lines mean there is no change in acceleration.
IV. Exploration • See Speed/Acceleration Lab worksheet for data. • Make a graph for each trial to show acceleration. • Make a graph to show each trial’s average speed.