MBI 2005 Workshop in Phylogenetics and Phylogeography
MBI 2005 Workshop in Phylogenetics and Phylogeography. Perspective an empiricist (and bird watcher!) Enthusiastic producer of DNA sequence data unabashed consumer of computational analysis packages Allele frequency approaches to population structure

MBI 2005 Workshop in Phylogenetics and Phylogeography
E N D
Presentation Transcript
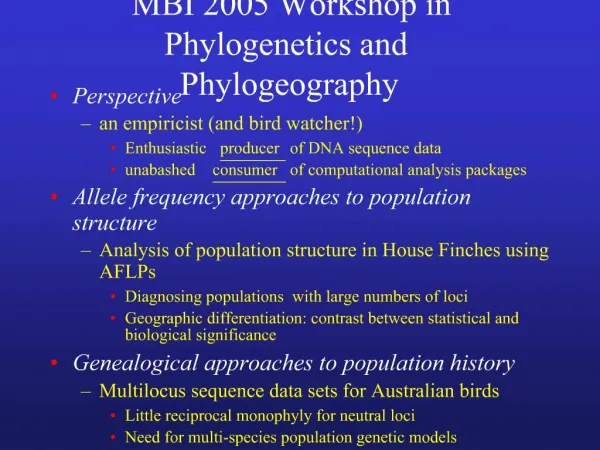
MBI 2005 Workshop in Phylogenetics and Phylogeography • Perspective • an empiricist (and bird watcher!) • Enthusiastic producer of DNA sequence data • unabashed consumer of computational analysis packages • Allele frequency approaches to population structure • Analysis of population structure in House Finches using AFLPs • Diagnosing populations with large numbers of loci • Geographic differentiation: contrast between statistical and biological significance • Genealogical approaches to population history • Multilocus sequence data sets for Australian birds • Little reciprocal monophyly for neutral loci • Need for multi-species population genetic models
House Finches and Mycoplasma:a recent host-parasite interaction • Mycoplasma gallisepticum escaped chickens and invaded House Finches in the eastern U. S., ~1994 • 9 years later, finches are more resistant to the bacterium and recent strains are attenuated • Have finches evolved resistance? • AFLP study: What is the geographic setting in which this epizootic took place?
Recent history of House Finch populations historic range ~1870 bottleneck? 1940 ~200 birds
163 individuals, 16 populations 3 primer combinations 166 polymorphic bands 61% polymorphic bands AFLP survey of House Finches Cassin’s Finch Purple Finch California Mexico Wang Z, et al. (2003) Evolution57, 2852-2864.
AFLPs: House Finch are moderately structured with little evidence for genetic bottlenecks Nucleotide diversity (estimated number of substitutions per 1000 sites) Distribution of variation (AMOVA) Among individuals w/in pops. original range introduced range 10 9 8 7 6 70.7% 5 8.1% 4 3 2 21.2% 1 0 Mex. Can. CA CA TX AR CO WA MI ME NY OH MD PA AL HI Among pops. w/in subspecies Among subspecies Wang Z, et al. (2003) Evolution57, 2852-2864.
Tripartite structure of House Finch populations suggested by assignment test of AFLP data (program STRUCTURE: J. Pritchard et al. 2000. Genetics 155: 945-959) Western U.S. Hawaii Eastern U. S. Wang Z, et al. (2003) Evolution57, 2852-2864.
Fst with large numbers of loci: statistical and biological significance Geogaphic distance (km) Wang Z, et al. (2003) Evolution57, 2852-2864.
Low resolution of population trees using AFLP data Wang Z, et al. (2003) Evolution57, 2852-2864.
Two rules of gene trees near the species boundary 1. Gene trees don’t always match the species tree2. Gene divergence often precedes population divergence Species tree Gene tree 2Ne T/2Ne
The need for estimating ancestral population size () when inferring species divergence time ( or ) present Time Time [generations] t [generations x m = number of mutations] /2 D T past
Pincongruence = 2/3e-2 / “Mismatch Method” Species vs. Gene Trees 1 2 3 1 3 2 2 3 1 congruent gene tree incongruent gene tree incongruent gene tree Nei 1987. Molecular Evolutionary Genetics Wu 1991. Genetics 127:429-435 Hudson 1992. Genetics 131:509-512 Yang 2002. Genetics 162:1811-1823 Rannala B, Yang Z. 2003. Genetics 164, 1645-1656.
Bayes Markov chain Monte Carlo (MCMC) method (Yang and Rannala) • - multiple independent loci • estimates ancestral q (present q also) • - estimates population divergence times • - uses branch length information • - accounts for uncertainty in gene trees • Assumptions: • “know” the species tree • - random mating • - no gene flow after population divergence • - free recombination among loci (not within) Yang 2002. Genetics 162:1811-1823 Rannala B, Yang Z. 2003. Genetics 164, 1645-1656
1 - 2 k b s h e a r e d f r a g m e n t s 1 . s o n i c a t i o n 2 . r e p a i r r a g g e d 4 . s e q u e n c e e n d s ; m a k e b l u n t r a n d o m c l o n e s 3 . c l o n e b l u n t f r a g m e n t s Advantages of SNPs over microsatellites • Mutational scale directly comparable to mtDNA • Mutational homoplasy is minimal • Gene trees easily constructed • Diversities easily compared across species Obtaining anonymous loci Genomic DNA 1-2 kb insert pUC 18 vector Brumfield R. et al. 2003TREE18, 249-256.
Ascertainment bias and sampling strategy for SNPs SNPs Microsatellites * * * * Diversity Diversity * * * * * * Locus 1 2 3 4 5 6 7 8 Locus 1 2 3 4 5 6 7 8 Locus chosen for phylogeographic survey * study population panel SNP
haplotype inference - (PHASE) amplification of autosomal diploid products Test for recombination indel resolution Pipeline for multilocus data analysis Demographic inference field sampling
AGGCGTTCTTACGACCTTAAGCTCATCCGATAATCTC haplotype 1 AGGCGTACTTACGACCTTAAGCTCATCGGATAATCTC haplotype 2 PHASE: Stephens M, Am. J. Hum. Genet. 68, 978-989. Resolving haplotypes from diploid PCR products A C AGGCGTCTTACGACCTTAAGCTCATCGATAATCTC diplotype G T
Resolving heterozygous indels viacloning or allele-specific PCR Jennings WB, Edwards SV (2005) Evolution in press.
Carpentarian barrier (B) is deepest split in area cladograms Cracraft J (1986) Evolution 40, 977-996.
Gene tree of western babbler lineage Migration event reconstructed by parsimony
Assumed phylogeny of Poephila finches c. atropygialis acuticauda hecki Black-throated Finch Long-tailed Finch
Characteristics of 30 anonymousloci from Poephila finches 9 7 8 6 7 5 6 4 5 Frequency Frequency 4 3 3 2 2 1 1 0 0 More 0.4 0.8 1.2 1.6 2.4 2.8 3.2 3.6 0 2 4 100 150 200 250 300 350 400 450 500 550 600 650 700 750 800 More Percent divergence Sequence length (bp) 7 6 5 Frequency 4 3 2 1 0 30 33 36 39 42 45 48 51 54 More % GC content Jennings WB, Edwards SV (2005) Evolution in press.
30 gene trees from Australian finches Jennings WB, Edwards SV (2005) Evolution in press.
prior, analysis 1 prior, analysis 2 posterior, analysis 1 posterior, analysis 2 ML estimate
Decreasing variance with increasing numbers of loci - mostly
Analysis suggests Pleistocene divergence across the Carpentarian barrier “Long-tailed Finch” “Black-throated Finch” acuticauda c. atropygialis hecki ha (t) 0.61 MY (0.35 MY - 86 MY) ha Ne= ~384,000 (240,000-530,000) hac(t)0.1 MY (0.01 MY - 0.34 MY) hac Ne= 521,000 (320,000-767,000) = 4Ne = t generation time = 1 year = ~3.6 x 10⁻⁹ substitutions/site/year (gamebirds)
gene divergence ( D / 2) Gene divergence (D/2) 3.00 population divergence ( ) - MLE g Population divergence () - MLE 2.80 population divergence ( ) - Bayesian g Population divergence () - Bayesian 2.60 2.40 2.20 2.00 Pliocene 1.80 Pleistocene 1.60 Divergence Time (MYA) 1.40 1.20 1.00 0.80 0.60 0.40 0.20 0.00 1 cincta vs. (acuticauda, hecki) acuticauda vs . hecki
Summary of Population Divergence Times Long-tailed Finch Black-throated Finch acuticauda atropygialis hecki Kimberley/ Arnhem Land Barrier (0.6 MYA) Carpentarian Barrier 0.7 MYA maps from Schodde and Mason 1999. The Directory of Australian Birds: Passerines
10 gene trees in Australian treecreepers Brown Treecreeper (eastern) lineages Black-tailed (western) Treecreeper lineages Cape York (far north) Pilbara (far west) AL3 AL5 AL7 AL14 AL16 + + + + + AL18 AL19 AL20 AL21 AL22 + + + + + +
Migrate analysis reveals extensive gene flow and geographic variation in population size Weipa Douglas Hot Springs = 0.0102 Fitzroy Crossing 0.0047 +/-0.0014 Forsayth Doomadgee Black-tailed Treecreepers Longreach Brown Treecreepers Newman Bourke Sedan Rotzel, Edwards and Beerli, unpubl. data
Implications of finch gene trees for selection and thegenealogical species concept acuticauda, hecki cincta Edwards et al. 2005 PNAS 102, 6550
Alternative models of population history: quo vadis? pure isolation model isolation-migration model equilibrium migration model
Conclusions • As the number of loci grows, distinguishing statistical from biological significance will be important • Is haplotype inference really necessary? • Lack of reciprocal monophyly will be common in vertebrate sequence data sets
Acknowledgements • Australian • phylogeography • Bryan Jennings • Nancy Rotzel • Peter Beerli • House Finch evolution • Geoff Hill • Zhenshan Wang • Funding • NSF