Download
1 / 55
900 likes | 2.07k Vues
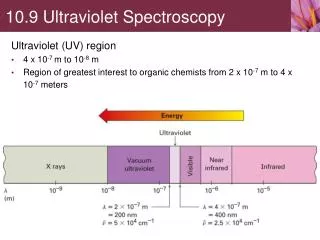
Molecular Spectroscopy Visible and Ultraviolet Spectroscopy. - UV/VIS Spectroscopy - UV/VIS Spectrometer - Application for Quantitative Analysis. Ultraviolet: 190~400nm Violet: 400 - 420 nm Indigo: 420 - 440 nm Blue: 440 - 490 nm Green: 490 - 570 nm Yellow: 570 - 585 nm

E N D
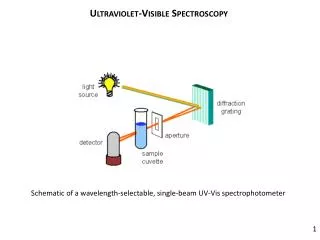
Molecular SpectroscopyVisible and Ultraviolet Spectroscopy -UV/VIS Spectroscopy-UV/VIS Spectrometer -Application for Quantitative Analysis
Ultraviolet: 190~400nm • Violet: 400 - 420 nm • Indigo: 420 - 440 nm • Blue: 440 - 490 nm • Green: 490 - 570 nm • Yellow: 570 - 585 nm • Orange: 585 - 620 nm • Red: 620 - 780 nm
Internal Energy of Molecules Etotal=Etrans+Eelec+Evib+Erot+Enucl Eelec: electronic transitions (UV, X-ray) Evib: vibrational transitions (Infrared) Erot: rotational transitions (Microwave) Enucl: nucleus spin (nuclear magnetic resonance) or (MRI: magnetic resonance imaging)
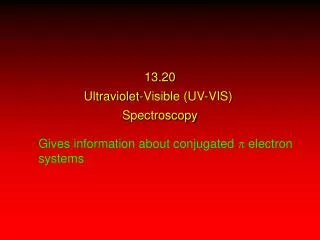
Electronic Spectroscopy • Ultraviolet (UV) and visible (VIS) spectroscopy • This is the earliest method of molecular spectroscopy. • A phenomenon of interaction of molecules with ultraviolet and visible lights. • Absorption of photon results in electronic transition of a molecule, and electrons are promoted from ground state to higher electronic states.
UV and Visible Spectroscopy • In structure determination : UV-VIS spectroscopy is used to detect the presence of chromophores like dienes, aromatics, polyenes, and conjugated ketones, etc.
Electronic transitions There are three types of electronic transition which can be considered; • Transitions involving p, s, and n electrons • Transitions involving charge-transfer electrons • Transitions involving d and f electrons
Absorbing species containing p, s, and n electrons • Absorption of ultraviolet and visible radiation in organic molecules is restricted to certain functional groups (chromophores) that contain valence electrons of low excitation energy.
Vacuum UV or Far UV (λ<190 nm ) UV/VIS
s ® s* Transitions • An electron in a bonding s orbital is excited to the corresponding antibonding orbital. The energy required is large. For example, methane (which has only C-H bonds, and can only undergo s ® s* transitions) shows an absorbance maximum at 125 nm. Absorption maxima due to s ® s* transitions are not seen in typical UV-VIS spectra (200 - 700 nm)
n ® s* Transitions • Saturated compounds containing atoms with lone pairs (non-bonding electrons) are capable of n® s* transitions. These transitions usually need less energy than s ® s * transitions. They can be initiated by light whose wavelength is in the range 150 - 250 nm. The number of organic functional groups with n® s* peaks in the UV region is small.
n® p* and p ® p* Transitions • Most absorption spectroscopy of organic compounds is based on transitions of n or p electrons to the p* excited state. • These transitions fall in an experimentally convenient region of the spectrum (200 - 700 nm). These transitions need an unsaturated group in the molecule to provide the p electrons.
Orbital Spin States • Singlet state (S):Most molecules have ground state with all electron spin paired and most excited state also have electron spin all paired, even though they may be one electron each lying in two different orbital. Such states have zero total spin and spin multiplicities of 1, are called singlet (S) states. Total Spin Multiplicities
Orbital Spin States • For some of the excited states, there are states with a pair of electrons having their spins parallel (in two orbitals), leading to total spin of 1 and multiplicities of 3. Total Spin Multiplicities
Orbital Spin States • For triplet state: Under the influence of external field, there are three values (i.e. 3 energy states) of +1, 0, -1 times the angular momentum. Such states are called triplet states (T). • According to the selection rule, S→S, T→T, are allowed transitions, but S→T, T→S, are forbidden transitions.
Selection Rules of electronic transition • Electronic transitions may be classed as intense or weak according to the magnitude of εmax that corresponds to allowed or forbidden transition as governed by the following selection rules of electronic transition: • Spin selection rule: there should be no change in spin orientation or no spin inversion during these transitions. Thus, S→S, T→T, are allowed, but S→T, T→S, are forbidden. (△S=0 transition allowed)
Terms describing UV absorptions 1.Chromophores: functional groups that give electronic transitions. 2.Auxochromes: substituents with unshared pair e's like OH, NH, SH ..., when attached to π chromophore they generally move the absorption max. to longer λ. 3.Bathochromic shift: shift to longer λ, also called red shift. 4.Hysochromic shift: shift to shorter λ, also called blue shift. 5.Hyperchromism: increase in ε of a band. 6.Hypochromism: decrease in ε of a band.
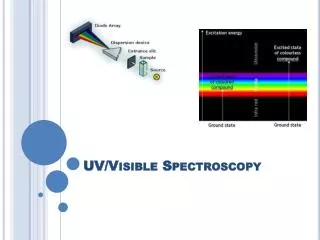
Instrumentation 光源 分光器 樣品 偵測器 記錄器
Components of a SpectrophotometerLight Source • Deuterium Lamps-a truly continuous spectrum in the ultraviolet region is produced by electrical excitation of deuterium at low pressure. (160nm~375nm) • Tungsten Filament Lamps-the most common source of visible and near infrared radiation.
Components of a SpectrophotometerMonochromator (分光器/單光器) • Used as a filter: the monochromator will select a narrow portion of the spectrum (the bandpass) of a given source • Used in analysis: the monochromator will sequentially select for the detector to record the different components (spectrum) of any source or sample emitting light.
Principle of Barrier Layer/Photovoltaic Detector • This device measures the intensity of photons by means of the voltage developed across the semiconductor layer. • Electrons, ejected by photons from the semiconductor, are collected by the silver layer. • The potential depends on the number of photons hitting the detector.
Principle of Photomultiplier Detector • The type is commonly used. • The detector consists of a photoemissive cathode coupled with a series of electron-multiplying dynode stages, and usually called a photomultiplier. • The primary electrons ejected from the photo-cathode are accelerated by an electric field so as to strike a small area on the first dynode.
Principle of Photomultiplier Detector • The impinging electrons strike with enough energy to eject two to five secondary electrons, which are accelerated to the second dynode to eject still more electrons. • A photomultiplier may have 9 to 16 stages, and overall gain of 106~109 electrons per incident photon.
Single and Double Beam Spectrometer • Single-Beam: There is only one light beam or optical path from the source through to the detector. • Double-Beam: The light from the source, after passing through the monochromator, is split into two separate beams-one for the sample and the other for the reference.
Quantitative AnalysisBeer’s Law A=ebc e: the molar absorptivity (L mol-1 cm-1) b: the path length of the sample c :the concentration of the compound in solution, expressed in mol L-1
Transmittance I0 I b
Standard Addition Method • Standard addition must be used whenever the matrix of a sample changes the analytical sensitivity of the method. In other words, the slope of the working curve for standards made with distilled water is different from the same working curve.
Prepare the Standards The concentration and volume of the stock solution added should be chosen to increase the concentration of the unknown by about 30% in each succeeding flask.
Limits to Beer’s Law • Chemical Deviations -absorbing undergo association, dissociation or reaction with the solvent • Instrumental Deviations -non-monochromatic radiation -stray light
Limits to Beer’s LawChemical Deviations • high concentration-particles too close • Average distance between ions and molecules are diminished to the point. • Affect the charge distribution and extent of absorption. • Cause deviations from linear relationship.