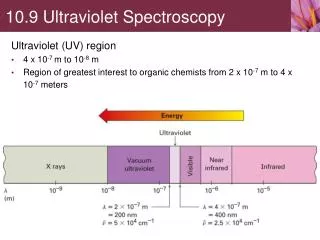
Ultraviolet-Visible Spectroscopy
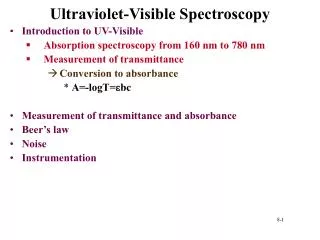
Ultraviolet-Visible Spectroscopy. Introduction to UV-Visible Absorption spectroscopy from 160 nm to 780 nm Measurement of transmittance Conversion to absorbance A=-logT= e bc Measurement of transmittance and absorbance Beer’s law Noise Instrumentation. Measurement. Scattering of light

Ultraviolet-Visible Spectroscopy
E N D
Presentation Transcript
Ultraviolet-Visible Spectroscopy • Introduction to UV-Visible • Absorption spectroscopy from 160 nm to 780 nm • Measurement of transmittance • Conversion to absorbance • A=-logT=ebc • Measurement of transmittance and absorbance • Beer’s law • Noise • Instrumentation
Measurement • Scattering of light • Refraction at interfaces • Scatter in solution • Large molecules • Air bubbles • Normalized by comparison to reference cell • Contains only solvent • Measurement for transmittance is compared to results from reference cell
Beer’s Law • Based on absorption of light by a sample • dPx/Px=dS/S • dS/S=ratio of absorbance area to total area • Proportional to number of absorbing particles • dS=adn • a is a constant, dn is number of particles • n is total number of particles within a sample
Beer’s Law • Area S can be described by volume and length • S=V/b (cm2) • Substitute for S • n/V = concentration • Substitute concentration and collect constant into single term e • Beer’s law can be applied to mixtures • Atot=SAx
Beer’s Law Limitations • Equilibrium shift • pH indicators • Need to consider speciation • Weak acid equilibrium
Beer’s Law Limitation • Polychromatic Light • More than one wavelength
Noise • Limited readout resolution • Dark current and electronic noise • Photon detector shot noise • Cell position uncertainty • Changing samples • Flicker
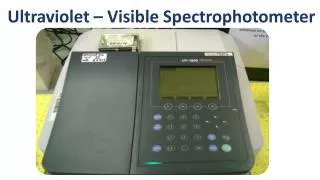
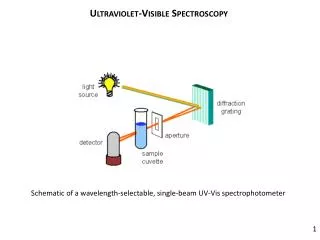
Instrumentation • Light source • Deuterium and hydrogen lamps • W filament lamp • Xe arc lamps • Sample containers • Cuvettes • Plastic • Glass • Quartz
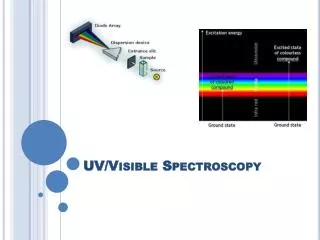
Spectrometer Time separated double beam
Spectrometer Dip probe Multichannel photodiode array
Application of UV-Visible Spectroscopy • Identification of inorganic and organic species • Widely used method • Magnitude of molar absorptivities • Absorbing species • methods
Molar Absorptivties • Range from 0 to 1E5 • e=8.7E19PA • P=transition probability • A=target cross section (cm2) • Allowed transitions 0.1>P>1 • e range 1E4 to 1E5 • Forbidden transition 0.01 • Absorbing species • M+g->M* • M* has a short lifetime (nanoseconds) • Relaxation processes • Heat • Photo emission • Fluorescence or phosphorescence
Absorbing species • Electronic transitions • p, s, and n electrons • d and f electrons • Charge transfer reactions • p, s, and n (non-bonding) electrons
Transitions • s->s* • UV photon required, high energy • Methane at 125 nm • Ethane at 135 nm • n-> s* • Saturated compounds with unshared e- • Absorption between 150 nm to 250 nm • e between 100 and 3000 L cm-1 mol-1 • Shifts to shorter wavelengths with polar solvents • Minimum accessibility • Halogens, N, O, S
Transitions • n->p*, p->p* • Organic compounds, wavelengths 200 to 700 nm • Requires unsaturated groups • n->p* low e (10 to 100) • Shorter wavelengths • p->p* higher e (1000 to 10000)
Transitions • d-d • 3d and 4d 1st and 2nd transitions series • Broad transitions • Impacted by solution
D transitions • Partially occupied d orbitals • Transitions from lower to higher energy levels • Splitting of levels due to spatial distribution similar Axial direction
D transitions • Binding ligands on axis have greater effect on axial orbitals
D transitions • D value dependent upon ligand field strength • <Br-<Cl-<F-<OH-<C2O42-~H2O<SCN-<NH3<en<NO2-<CN- • D increases with increasing field strength • f-f • 4f and 5f (lanthanides and actinides) • Sharper transitions
Actinide transitions Figure 2: UV-vis spectra of organic phases for 13M HNO3 system
Charge-transfer Transitions • Electron donor and acceptor characteristics • Absorption involves e- transitions from donor to acceptor • SCN to Fe(III) • Fe(II) and neutral SCN • Metal is acceptor • Reduced metals can be exception
Electronic Spectra • Cr(NH3)63+ • d3 • Weak low energy transition • Spin forbidden • 2 stronger transitions • Spin allowed • t2g and eg transitions • Lower energy to higher energy • CT at higher energy • Ligand to metal transition
Charge transfer bands • High energy absorbance • Energy greater than d-d transition • Electron moves between orbitals • Metal to ligand • Ligand to metal • Sensitive to solvent • LMCT • High oxidation state metal ion • Lone pair ligand donor • MLCT • Low lying pi, aromatic • Low oxidation state metal • High d orbital energy
Methods • Titration • Change of absorbance with solution variation • pH, ligand, metal • Photoacoustic effect • Emission of sound