STANDARD NORMAL DISTRIBUTION
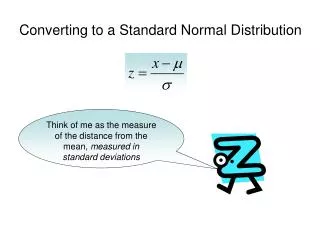
STANDARD NORMAL DISTRIBUTION. All normal distributions are same when standardized Find areas under normal curve from table that gives areas under curve for standard normal distribution


STANDARD NORMAL DISTRIBUTION
E N D
Presentation Transcript
STANDARD NORMAL DISTRIBUTION • All normal distributions are same when standardized • Find areas under normal curve from table that gives areas under curve for standard normal distribution • table tells us proportions of values that lie above or below a certain distance from the mean (standard deviations) for any standardized distribution • THE STANDARD NORMAL TABLE • TABLE A
STANDARD NORMAL TABLE • The table entry for each value z is the area under the curve to the left of z. Picture on page 57
STANDARD NORMAL DISTRIBUTION 3.10 Use table A to find the proportion of observations from a standard normal distribution that satisfies each of the following statements. In each case, sketch a standard normal curve and shade the are under the curve that is the answer to the question. • Z < 2.85 • Z > 2.85 • Z > -1.66 • -1.66 < z < 2.85
STANDARD NORMAL DISTRIBUTION 3.11 An important measure of the performance of a locomotive is its “adhesion” which is the locomotive’s pulling force as a multiple of its weight. The adhesion of one 4400-horspower diesel locomotive model varies in actual use according to a normal distribution with mean 0.37 and standard deviation of 0.04. • What proportion of adhesions measured in use are higher than 0.40? • What proportion of adhesions are between 0.40 and 0.50? • Improvements in the locomotive’s computer controls change the distribution of adhesion to a normal distribution with mean 0.41 and standard deviation of 0.02. Find the proportions in (a) and (b) after this improvement.
STANDARD NORMAL DISTRIBUTION 3.12 Use Table A to find the value z of a standard normal variable that satisfies each of the following conditions. (Use the value of z from table A that comes closest to satisfying the condition). In each case, sketch a standard normal curve with your value of z marked on the axis • The point z with 25% of the observations falling below it. • The point z with 40% of the observations falling above it.
STANDARD NORMAL DISTRIBUTION 3.13 Scores on the Wechler Adult Intelligence Scale are approximately normally distributed with mean of 100 and standard deviation of 15. • What IQ scores fall in the lowest 25% of the distribution? • How high an IQ score is needed to be in the highest 5%?