STANDARD NORMAL DISTRIBUTION
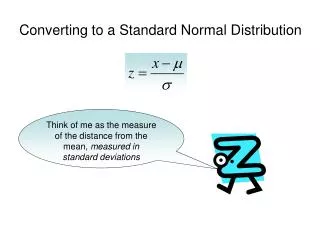
STANDARD NORMAL DISTRIBUTION. STANDARD NORMAL DISTRIBUTION RELATIONSHIP BETWEEN x AND z. If a random variable X is normally distributed with mean and standard deviation , then. STANDARD NORMAL DISTRIBUTION TABLE, z -VALUES, AREA AND PROBABILITY.


STANDARD NORMAL DISTRIBUTION
E N D
Presentation Transcript
STANDARD NORMAL DISTRIBUTIONRELATIONSHIP BETWEEN x AND z • If a random variable X is normally distributed with mean and standard deviation , then
STANDARD NORMAL DISTRIBUTION TABLE, z-VALUES, AREA AND PROBABILITY Example 1.1:Table 3, Appendix B, p. 837 shows the area under the curve from z=0 to some positive z value. For example, the area from z=0 to z=1.3+.04=1.34 is 0.4099.
STANDARD NORMAL DISTRIBUTION TABLE, z-VALUES, AREA AND PROBABILITY Example 1.2:The area shown on the table can be used to get many other areas. For example, using the fact that the area on each of the left and right side of the mean is 0.5, the area from z=1.34 to z= is 0.5-0.4099=0.0901.
STANDARD NORMAL DISTRIBUTION TABLE, z-VALUES, AREA AND PROBABILITY Example 1.3:Using symmetry, we can get the area under the curve from z=0 to some negative z value. For example, the area from z=-1.34 to z=0 is 0.4099.
STANDARD NORMAL DISTRIBUTION TABLE, z-VALUES, AREA AND PROBABILITY Example 1.4:Using symmetry, we can also get the area under the curve from z=- to some negative z value. For example, the area from z=- to z=-1.34 is 0.0901.
STANDARD NORMAL DISTRIBUTION TABLE, z-VALUES, AREA AND PROBABILITY Example 1.5:Using the fact that the area on each of the left and right side of the mean is 0.5, the area from z=- to z=1.34 is 0.5+0.4099=0.9099.
STANDARD NORMAL DISTRIBUTION TABLE, z-VALUES, AREA AND PROBABILITY Example 1.6:Using symmetry, the area from z=-1.34 to z= is 0.9099.
STANDARD NORMAL DISTRIBUTION GIVEN z, FIND PROBABILITY Example 2: Find the following:
STANDARD NORMAL DISTRIBUTION GIVEN z, FIND PROBABILITY : EXCEL Excel function NORMSDIST(z) provides the area under the standard normal distribution curve on the left side of z. For example, NORMSDIST(1.34) = 0.9099 =
STANDARD NORMAL DISTRIBUTION GIVEN PROBABILITY, FIND z : NOTATION zA represents that value of z for which area on the right is A. So, For example, the area on the right side of z=1.96 is 0.025. Hence, z.025=1.96.
STANDARD NORMAL DISTRIBUTION GIVEN PROBABILITY, FIND z Example 3: Determine zA and locate its value on the graph of the standard normal distribution each of the following values of A: 1. 0.003 2. 0.05
STANDARD NORMAL DISTRIBUTION GIVEN PROBABILITY, FIND z : EXCEL Excel function NORMSINV(1-A) provides the value of zA. For example, NORMSINV(1-0.025)=1.96=z.025
NORMAL DISTRIBUTION GIVEN x, FIND PROBABILITY Example 4.1: A retailer has observed that the monthly demand of an item is normally distributed with a mean of 650 and standard deviation of 50 units. What is the probability that the demand of the item in the next month will not exceed 700 units? 1. Compute z 2. Find area from the Table 3. Find probability
NORMAL DISTRIBUTION GIVEN x, FIND PROBABILITY Example 4.2: A retailer has observed that the monthly demand of an item is normally distributed with a mean of 650 and standard deviation of 50 units. What is the probability that the demand of the item in the next month will exceed 600 units? 1. Compute z 2. Find area from the Table 3. Find probability
NORMAL DISTRIBUTION GIVEN x, FIND PROBABILITY Example 4.3: A retailer has observed that the monthly demand of an item is normally distributed with a mean of 650 and standard deviation of 50 units. What is the probability that the demand of the item in the next month will be between 600 and 700 units? 1. Compute z1 and z1 2. Find areas from the Table 3. Find probability
NORMAL DISTRIBUTION GIVEN x, FIND PROBABILITY : EXCEL Excel function NORMDIST(x,,,TRUE) provides the area under the standard normal distribution curve on the left side of x. For example, NORMDIST(700,650,50,TRUE) = 0.8413
NORMAL DISTRIBUTION GIVEN PROBABILITY, FIND x Example 5: A retailer has observed that the monthly demand of an item is normally distributed with a mean of 650 and standard deviation of 50 units. If the retailer wants to limit the probability of stock out to 0.10, how many units should be ordered for the next month? Assume that there is no units in the inventory. 1. Find zA from the table 2. Find x
NORMAL DISTRIBUTION GIVEN PROBABILITY, FIND x : EXCEL Excel function NORMINV(p,,) provides that value of x for which the area under the standard normal distribution curve on the left side of x is p. For example, NORMINV(0.90,650,50) = 714.
NORMAL APPROXIMATION TO BINOMIAL CONTINUITY CORRECTION • The normal distribution can be used to approximate other distributions including binomial distribution. • The approximation is useful for large number of trials, nfor which use of formula is not convenient and table is not available. • From our previous discussion, if X is a binomial random variable, the mean, and the standard deviation, of Xare: • n is the number of trials • p is the probability of success on each trial • q is the probability of failure on each trial = 1-p
NORMAL APPROXIMATION TO BINOMIAL CONTINUITY CORRECTION • Continuity correction: • Binomial probability P(X=a) is approximated by normal probability P(a-0.5 X a+0.5) • This simple rule gives rise to many adjustments Binomial Normal P(X=a) P(a-0.5 X a+0.5) P(aX b) P(a-0.5 X b+0.5) P(X b) P(X b+0.5) P(X a) P(X a-0.5)
NORMAL APPROXIMATION TO BINOMIAL CONTINUITY CORRECTION Example 6.1: If you toss a fair coin 36 times, what is the probability of getting 18 heads?
NORMAL APPROXIMATION TO BINOMIAL CONTINUITY CORRECTION Example 6.2: If you toss a fair coin 36 times, what is the probability of getting 12 to 24 heads?
NORMAL APPROXIMATION TO BINOMIAL CONTINUITY CORRECTION Example 6.3: If you toss a fair coin 36 times, what is the probability of getting at most 24 heads?
NORMAL APPROXIMATION TO BINOMIAL CONTINUITY CORRECTION Example 6.4: If you toss a fair coin 36 times, what is the probability of getting at least 12 heads?
READING AND EXERCISES • Reading: pp. 262-274 • Exercises: 7.6, 7.8, 7.12, 7.22