Download
1 / 57
580 likes | 775 Vues
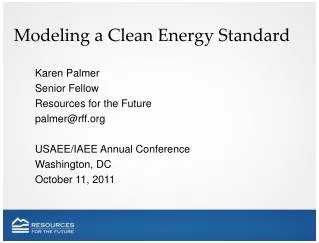
Global Energy Modeling. Dick Lawrence Berlin 2004. Photo from Jim Baldauf. Agenda. Introductions – who’s here Why we are here Presentation Discussion Is this the right thing to do? What does the project look like? How many people, and who? Modeling expertise? University connections?

E N D
Global Energy Modeling Dick Lawrence Berlin 2004 Photo from Jim Baldauf World Energy Modeling
Agenda Introductions – who’s here Why we are here Presentation Discussion • Is this the right thing to do? • What does the project look like? How many people, and who? • Modeling expertise? • University connections? • How is it funded? Sponsoring organizations? • Time frame: start => end • Modeling tools ARs – • What do we do next? • When do we meet next? World Energy Modeling
Energy Matters 1 “Energy is at the core of virtually every problem facing humanity. We cannot afford to get this wrong. We should be skeptical of optimism that the existing energy industry will be able to work this out on its own.” Testimony of witness Dr. Richard E. Smalley to the Senate Committee on Energy and Natural Resources – Full Committee Hearing on sustainable low-emission electricity generation, 27 April, 2004 Dr. Smalley is Director of the Carbon Nanotechnology Laboratory at Rice University World Energy Modeling
Energy Matters 2 “… the momentous decisions we take in the next few years will determine whether our heirs thank us or curse us for the energy choices we bequeath to them.” Alex Kirby, BBC News Online environment correspondent, 19 April 2004 World Energy Modeling
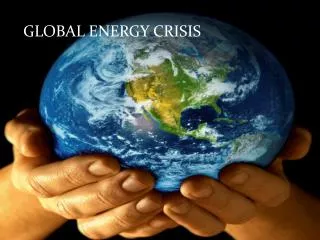
Everything Depends on Energy Whatever cause motivates you will be a lost cause if we do not have the energy to sustain society, industry, and agriculture in something like its present form … • Raising standard of living in developing nations • Reducing disease and illiteracy • Eliminating hunger and famine in Africa, Asia, South America • “Sustainable development” and economic growth • Extending democratic institutions around the world World Energy Modeling
Energy? Not a Problem … Right? Why is it so hard to communicate the Peak Oil message? • The Boy Who Cried Wolf … “we’ve heard that before” • “They’re always finding more oil!” (true, but …) • Reserves/production = “40 years, at present rate of use” Acknowledging Peak Oil is only the first step toward understanding the problem: • “OK, I buy your Peak Oil story, but market forces will ensure adequate energy for everyone – when prices go up, people will find alternatives!” (free-market theory) • “OK, I buy your Peak Oil story, but we’ve got 40 years for science and technology to come through with something!” (they always did, before) World Energy Modeling
Everyone Agrees “Peak Oil” is Just a Matter of Time But… huge uncertainty as to WHEN • Optimistic or contradictory oil and gas projections lead to complacency and confusion • No agreement on consequences of peak oil, whenever it comes Result: Little has been done since oil crisis of 1973 - • Contribution of “renewables” still very small • Nuclear is practically at a standstill • Economic recovery leading to record consumption of oil, gas, and coal => what about global warming? World Energy Modeling
Energy Future According to ASPO Energy Future According to USGS Huge Disagreement! How can something this important have so much uncertainty? (+/-100%!) 120 100 URR According to USGS, IEA, … URR = 3 Trillion Bbl 2+ Trillion Remaining 80 World URR According to ASPO 60 URR = ~2 Trillion Bbl 1+ Trillion Remaining 40 OPEC 20 ROW-Russia USA 0 1920 1940 1960 1980 2000 2020 2040 World Energy Modeling
1) No Agreement on Crude Oil URR • Unreliable, missing, or unbelievable reserve numbers • Variable estimates for “reserve growth” applied at global level • How much “Yet to Be Discovered” exists? • Disagreement on impact of new technology • Uncertainty re. relation of price to exploration, discovery, and extraction rates • Wildly-varying estimates for future production rates and URR for tar sands, Venezuela heavy, shale oil World Energy Modeling
2) More Reasons for Confusion and Complacency For every Fossil-Fuel alarmist, there is another expert saying “No problem” Opinions run the gamut: • Utopian scenarios of fusion-enabled hydrogen-fueled industry, transport, and agriculture • Magical reversion to 18th-century way of life • Cataclysmic scenarios of war, starvation, death Without science or numbers behind them, all opinions are equally valid World Energy Modeling
Oil Demand Exceeding Expectations Population – world population projected to continue rising past 2050 or later (9-10 B) Industrial development – China’s oil imports rise 30+% in 2003, surpasses Japan; India and rest of SE Asia also exploding demand Middle-class aspirations in China, India Although losing industry, N American demand continues to rise – transport, electricity, gas Rest of world coming out of recession – EIA repeatedly raising estimates of demand World Energy Modeling
Agriculture was once very labor-intensive in human and animal power; what will substitute for fossil fuels now that we number 6.4 billion (heading for 9 to 10 billion) ? Agriculture US horse population peaked in 1915 at 25 million; 20% of all arable US land was used to feed horses. US humans numbered 100 million. In 2015, expect 300M people. We have never seen a plan for feeding 9 billion people without fossil fuel! World Energy Modeling
100 80 World World World World World 60 OPEC OPEC OPEC OPEC OPEC 40 20 ROW-Russia ROW-Russia ROW-Russia ROW-Russia ROW-Russia USA USA USA USA USA 0 2300 2200 2200 1880 2100 2100 2100 2060 2060 2080 1900 1900 1900 1920 1940 1800 1960 1800 1980 1980 1980 2000 2000 2000 2000 2000 2000 2000 2020 2040 1700 2040 2040 2040 1920 1920 1920 1960 1960 1960 2020 2020 1940 1940 The Big Picture – Oil Production over History M bbl/day ? World Energy Modeling
What the World Needs Now Better data on reserves, production capability (Simmons, Bakhtiari, Campbell et al) – improve forecasts of future oil, gas production A good world energy model (us, here) – improve our ability to: • Accompany ASPO’s Peak Oil message with energy modeling to show its implications • Understand consequences of decisions made • Analyze relative feasibility and net energy of future energy scenarios World Energy Modeling
Complex Systems Modeling History Big Studies • Limits to Growth (Meadows et al 1972) • Beyond Oil (Gever, Kaufmann, Skole, Vorosmarty 1986, 1991) Techniques, Papers, Books • HT Odum, Cutler Cleveland, Charles Hall … Modeling Software and Systems • Must handle hundreds of variables, complex feedback relationships • Limits to Growth – IBM mainframe, MIT • Beyond Oil – Fortran on a Prime supermini • Now: Stella – dynamic systems modeling software, used by Richard Duncan and others World Energy Modeling
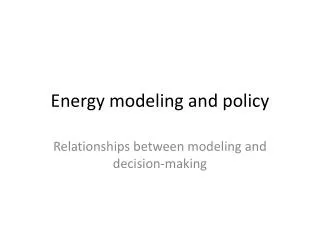
Linking Multiple Models • There are many different “energy models”, most dealing with one aspect of energy – typically focusing on supply only, or demand only, or one particular type of energy • Imagine a modeling structure that could tie several models together: output of one model (for example) can be input to another; • No model known tackles the problem in a holistic, worldwide and integrated way; we want to understand the implications of an integrated supply and demand model, for all types of energy World Energy Modeling
What’s an Energy Model Good For? • Raise awareness of fossil-fuel depletion and its consequences for global policy makers, decision makers • Analyze and quantify the consequences of fossil-fuel depletion on agriculture, industry, commerce and homes • Show the impact of different rates of adoption for various mixes of renewable/fossil/nuclear sources • Make world energy information program-accessible, in one database, in standardized format • With standardized and rigorous ERoEI methodology, show what mix of conventional and renewable energies has the best outcome – point the way, avoid dead ends World Energy Modeling
What’s an Energy Model Good For? (detail) • Impact of ERoEI on URR (example) • Impact of ERoEI on NET ENERGY (example) • Quantify impact of delaying investment in alternatives (example) • Critical analysis of alternative energy sources • The Hydrogen Economy • Biofuels like ethanol • Tar sands and other unconventional oil • Shale oil • Nuclear power World Energy Modeling
Unavailable URR URR Impact of ERoEI on URR Net Energy Return per Energy Invested Hard Total Energy Invested Easy Time World Energy Modeling
Understanding Net Energy • All energy sources require up-front investment in energy, as well as $ capital and human effort, to yield a return on that investment • NET ENERGY: Energy Returned on Energy Invested = ERoEI • Some investments are better than others • Some investments are energy losers! • How can we know which ones to invest in? World Energy Modeling
3% decline per year Useful Lifetime 25 Years The Energy Cost of Energy - NET ENERGY Analysis 75 100 Cumulative new energy from investment Annual contribution from alternate energy source World Energy Modeling
85 Available (net) Energy after Investment The Energy Cost of Energy - NET ENERGY Analysis 75 60 100 Cumulative new energy from investment World Energy Modeling
Net Energy Production 120 100 80 60 40 20 0 begin investment before decline Begin investment during decline 0 10 20 30 40 Time Consequence of Delayed Investment From Beyond Oil, fig. 7-1 World Energy Modeling
Comparative Analysis of Future Energy Resources • Any realistic future contains a mix of energy sources; what’s the best mix? • Which are the energy losers and dead ends? • Where should we invest our energy and $ capital for the best return (net energy), best long-term sustainable future, and best outcome for the environment? Good data and a high-quality model will point the way World Energy Modeling
Model Structure and Organization • Database of best-known world energy information • World energy information is program-accessible • Use of spreadsheets as database inputs, outputs, and program-to-program intermediary • Can link multiple programs for energy supply, energy demand, mixes of renewable energy • Peripheral programs may input data on oil & gas production, demand, population, … • Model output shown as graphs, tables – future total energy and per-capita net energy by type, by region, by year, as function of scenario World Energy Modeling
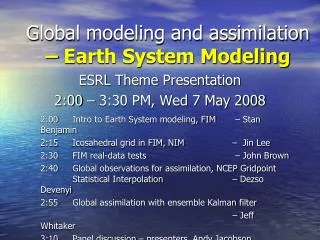
Model Structure (example) UN Population Model Energy Demand Model Model Core Dynamic System Simulation (Stella or similar software) Spreadsheet- database Future Scenario Spreadsheet- database Oil & Gas Supply Model Input data from IEA, BP,USGS, O&G Journal Spreadsheet- database ASPO Oil-Gas Model, OPEC Model, Wocap World Energy Modeling
Model Attributes • Transparency • Model inputs are databases / spreadsheets • Database inputs & outputs directly human-viewable as spreadsheets, or easily converted to spreadsheets • Inner workings of model and underlying assumptions are visible and easy to understand • Accessibility • Any reasonably-equipped PC can run the models and view results • Modeling software is reasonably priced, or shareware, or free World Energy Modeling
Model Attributes (detail) • Linkable • One model can feed into another via standardized database (e.g. spreadsheet) • Standardized Database Format • “Oil Export from Nigeria in 1997” goes to predetermined (Row 97) location in “Africa Production” spreadsheet • Every program has SW modules that tell it where to get input data, and where to put output data • Database Structure Has Extensible Detail Level • Data in any cell of a spreadsheet can be sourced from another page of the spreadsheet, or another spreadsheet – down to oil-field level of detail, if wanted World Energy Modeling
Example of Per-Country Energy Spreadsheet Country X World Energy Modeling
By-Country Database Development • View adjacent countries as 3D space with energy flows across the boundaries; • Track all energy flows – all types of fossil-fuel imports, exports; electricity; include storage, gas-to-liquid, refinery gain; • Show consumption of all types (net energy of typeX in = consumption + storage); • checking mechanism: S(all imports) = S(all exports) for each energy type, elec generation & consumption World Energy Modeling
Tracking Energy Flow Between Countries “Country” is natural boundary for a spreadsheet – IEA data, BP data, etc. all on per-country basis • checking mechanism: S(all imports) = S(all exports) for each energy type, elec gen’n & cons’n World Energy Modeling
Building the World Energy Model What’s Needed • Work together and agree on goals, scope, and process • Identify several strong and committed co-sponsoring organizations • Develop preliminary project and funding plan • Core team of 4-6 experienced staff for 2-3 years, with solid academic connections & resources • Need a strong visionary leader and experienced modeling advisors • Identify funding sources to meet staffing requirements • Develop model; use worldwide Internet, academic connections for data-entry job developing machine-readable database / spreadsheets; • Agree on initial scenarios, start model runs, document results World Energy Modeling
Long-Term Prospect Funded team runs scenarios on model, documents results – but, the need does not end there! World’s need to keep model updated, improve it, run new scenarios will continue beyond this decade The People’s Energy Model • Outreach program: Train others to develop and run scenarios • Continue to refine detail and accuracy in model’s database • Set up energy equivalent to Open Software Foundation for long-term continuing development, maintenance, and future scenario running • Could be some great PhD dissertations in this! World Energy Modeling
Thanks to Ken Deffeyes and son for the design! Your Name Here End of Presentation It’s Up to You Now First Meeting of The Club of BerlinIs Now Called to Order World Energy Modeling
Backup World Energy Modeling
Outline & notes Things to add: need better reserve estimates, more transparency, standardized test & reporting methods; (reserve growth) The fact that the remaining amount of such a critical resource to global industry, commerce, and civilization as we know it can have such a wide range of estimates ought to be a huge concern for anyone planning more than a decade into the future; governments plan social security, transportation systems, Need better oil & gas future production estimates Need robust ERoEI technique and numbers for FF, nuclear, renewable energy sources Outline: • Uncertainty over oil, gas reserve estimates 2:1 range • Complexity of economic/energy analysis: response of price to shortage, response of demand to price, • Modeling World Energy Modeling
You are here History and Future of Oil Supply Oil & NGL’s, from ASPO World Energy Modeling
Energy Supply • ODAC database for all liquid fuels • Samsam Bakhtiari’s Wocap program • Projections from the reference case of OPEC’s World Energy Model, “OWEM” • Richard Shepherd, Maarten van Mourik – see Word doc • Other supply-side programs • Near-term production estimates use known mega-project developments; longer-term, on basis of known discovery and any other data • breakdown by region • breakdown by type • contribution of fossil fuel alternatives • Take into account all known constraints on development and production • Some “yet-to-be-discovered” will never be discovered due to energy cost of finding and developing (see Lower48 actual vs. USGS projections) World Energy Modeling
? The Supply-Demand Gap Constant per-Capita Energy 100 80 World 60 40 OPEC 20 ROW-Russia USA 0 1920 1940 1960 1980 2000 2020 2040 World Energy Modeling
Energy Demand Trend • historical; % per year now (1.7%?) • basis: population, development, growing expectations • per-capita • by region • by use-type • special mention: China World Energy Modeling
Energy Demand • If world per-capita energy is to remain constant • Population models or tables (UN) are inputs 1AD = 170M, 1500 = .5B, 1804 =1B, 1938 2B, now 6.5B; 2.5B bbl/yr to 27B. Avg rate 0.5% for 5K yrs, now 1.3% • By-country data and trends • Monitor trends in domestic consumption of Oil-Exporting countries • Tellus Institute model? • Complication: feedback of supply, demand, mismatch and price => demand World Energy Modeling
Energy Demand Trend • historical • per-capita • by region • by use-type World Energy Modeling
Supply-Demand Mismatch • No near-term substitute for oil • US Hubbert peak 1970 • World Hubbert peak (plateau?) 2005-2010 • (highlight the gap btwn production curve and demand curve) – see Bakhtiari World Energy Modeling
The Mismatch Show 2 graphs: the pessimist (“realist") version, the optimist (conventional wisdom) version Ask “how much time do we have left?” for case 1, case 2 World Energy Modeling
Alternative Energy Sources • alternative contribution now • hydro, wind, solar, biomass, ... • hydrogen is not an energy source • negative ERoEI for methanol, etc. • capital and energy costs of developing the infrastructure • estimated ERoEI for each type • nuclear and coal World Energy Modeling
Searching for Our Energy Future • Rush to coal will accelerate already-high CO2 growth • Nuclear is politically problematic • Concern about weapons proliferation • New issues as terrorist target • Controversial and unpopular in Europe, N America • Alternatives to oil • Coal to liquid • NatGas to liquid • Tar sands & Shale Oil World Energy Modeling
Likely energy mix scenario • creation of alternative energy infrastructure large enough to make a contribution takes capital, and energy • chart from Beyond Oil: per-capita energy decline as function of delay in transition to alternatives • Run the scenarios with ERoEI, quantify energy diverted to building/acquiring new infrastructure • Many are convinced we should be undertaking massive transitions NOW – while FF energy is still cheap and abundant - to renewable / sustainable sources of energy – but can’t prove it • Not convinced that market “price signals” are working well enough to avert disaster • A good model should be able to quantify the net-energy impact of delaying deployment of alternative energy sources World Energy Modeling
Mio t Oil production Oil production ? OPEC USA ROW-Russia The Big Picture World Energy Modeling
The Big Picture • Population trend • Graph of population and fossil-fuel use • Industrialized agriculture • Humans as detritovores, in overshoot • Concept of sustainable population • Leibig’s theory of population constraint; relation to globalization and increased interdependence • The numbers: est’d peak ~10B; decline to 0.5B-2B in next 40 years? World Energy Modeling
The Big Picture (cont’d) • Population and energy • Malthus, Ehrlich, Jimmy Carter, and the Club of Rome were right • Factors presently reducing sustainability for post-fossil-fuel humanity • pollution & environmental degradation • soil degradation and aquifer depletion • majority of world fisheries over-fished World Energy Modeling