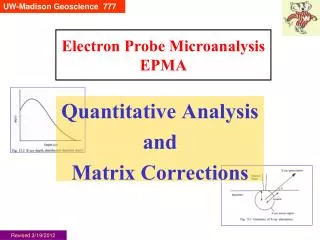
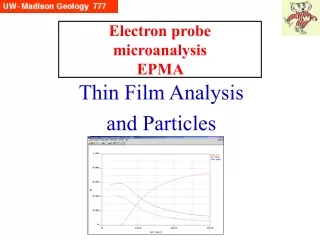
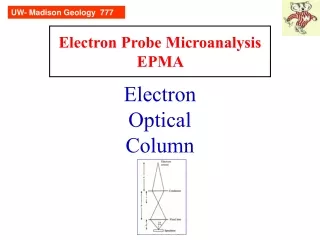
Electron probe microanalysis EPMA
Electron probe microanalysis EPMA. Cathodoluminescence. Modified 11/10/08. What’s the point?.

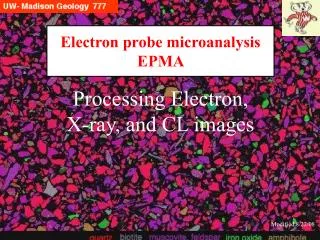
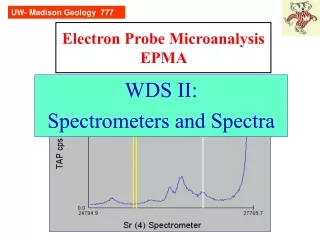
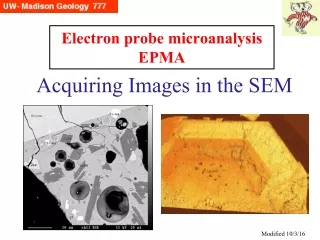
Electron probe microanalysis EPMA
E N D
Presentation Transcript
Electron probe microanalysisEPMA Cathodoluminescence Modified 11/10/08
What’s the point? Some materials, when excited by electrons, produce certain ‘secondary’ electron excitation which then releases small quanta of energy in the range of a few eV…which translated into wavelengths, is the visual light spectrum. CL images can yield valuable information not easily seen by other means.
What it’s not Photoluminescence: radiation caused by excitation by UV or visible light (1.8 to 4.9 eV) Nor Phosphorescence: radiation that persists after the incident energy source is turned off But it is under the general category of Fluorescence, which is where the radiation ceases immediately (within 10-8 sec) following cessation of the source.
Cathodoluminescence This is an optical (visible/nearly visible light) phenomenon. CL occurs in semiconductors/insulators, be they man-made or natural. Electrons in the valence band of these materials are excited into the conduction band for a brief time; subsequently these electrons recombine with the holes left in the valence band. The energy difference is released as a photon of wavelength of light. Two commonly used applications are Locating strain (lattice mismatch) in semiconductors, and Evaluating minerals for heterogeneous growth (complex history, overgrowths, dissolution, crack infilling).
Seeing The Light There are two distinct methods to image this effect: by SEM or microprobe, or by a small attachment to an optical microscope (static cold cathode electron source). Additionally, the light spectra can be quantified by a scanning monochronometer.
EXAMPLES CL captured on color film:A: Casserite, SnO2 B: Crinoidal limestone C: Red = dolomite, orange = calcite; dark grey = baddeleyite (ZrO2) D: St Peter Sandstone; mature quartz with zoned authigenic quartz overgrowths (from Marshall,1988, CL of Geological Materials) A B CL: in living color D C The CL emitted is of varying wavelengths (=colors), and can be captured with the right equipment. Various “CL microscope attachments” have been built that fit on the stage of a regular microscope; one model is the (cold cathode) Luminoscope.
(Cold) CL Microscope Attachments Cold cathode gun CMAs are relatively inexpensive attachments to microscopes. A high voltage (10-30 keV) cold cathode gun discharges electrons in a low vacuum chamber (rough pump only). A plasma results that provides charge neutralization (no carbon coating necessary). A camera (film or digital) and/or monochrometer are attached to acquire images and/or wavelength scans of the light. (From Marshall, 1993,The present state of CL attachments for optical microscopes, Scanning Microscopy, Vol 7, p. 861)
SEM/EP CL detectors Above: PM on SX51 Top Right: Gatan PanaCL on Hitachi: mirror inside chamber, inserted to operating position directly below pole piece; Below Right: PM with filters outside chamber
CL: ‘jumping the band gap’ This figure demonstrates several different mechanisms whereby photons are emitted in the process of high voltage electrons promoting valence electrons to conduction band.
CL: colors and eV The various band gap energies with their respective wavelengths and colors is shown here. (image from Marshall, 1988, Fig 1.4, p. 4)
Theories about CL One term in common usage is “intrinsic CL”, which is meant to mean that some minerals inherently emit CL, e.g. that nearly all silicates have CL in the blue region. However, this is not a totally satisfactory statement. Intrinsic CL can be enhanced by non-stoichiometry structural imperfections poorly ordered radiation damage shock damage impurities, substitutional or interstitial, which distort the lattice Note: these modify the bonds and electronic structure.
Impurities: activators/quenchers Substitution of an element for the ‘usual’ one (e.g. Ti 4+ for Si4+ in quartz, Mn 2+ for Ca 2+ in calcite) is believed to be a key cause of distortion of the lattice (=a defect) in the mineral. Impurities which function thusly are called “activators”. A few elements can perform the opposite role: modify the energy level arrangement so that the CL process does not operate or is diminished. These are “quenchers”, with Fe2+ being the most common. If the quencher level is low, it is possible that only a few ppm (or 50 ppb) of an activator is enough for CL emission.
Too much activator? It has been observed that CL intensity generally increases with increasing abundance of the activator ion, reaches a maximum and then “there is too much of a good thing” and the CL decreases as the activator level increases. The maximum CL intensity seems to occur when the activator level is in the 0.1 - 1 wt level; e.g. CL intensity in doped feldspars is maximum at ~1.5 wt% Fe 3+ or Mn 2+.
Pretty Colors A given mineral can accept different activators, and a give out a different CL color for each: feldspars can accept Eu3+ - blue, Mn2+ - greenish yellow, and Fe3+ - red. A given activator may be incorporated by different minerals, and produce different colored CL in them: e.g. Mn2+ can be accepted by feldspars - greenish yellow, apatite - yellow, and carbonates - reddish-orange. Several of the REE activators (e.g., Dy3+, Sm3+, Eu3+) produce very sharp ‘line’ spectra whose wavelength is almost independent of the host mineral, and can be used to qualitatively analyze the element content.
CL spectra Goetze, 2002
Temperature effects The intensity of CL can be altered by changing the sample temperature; there apparently are examples for increased intensity (in different materials) with both higher and lower temperatures. It has been shown that quartz CL can be enhanced by cooling the sample.
Time dependent effects The intensity of CL can deteriorate with time under electron beam bombardment, and is called ‘electron beam aging’ in the phosphor industry. However, this is not believed to be a serious issue “under normal beam conditions and viewing times”. It has been reported to occur in quartz, over tens of seconds, and that there is a color change from blue to red. Goetze, 2002
Time dependent effects It is also obvious that SEMs with ‘normal vacuums’ with oil backstreaming easily cover the sample with a very thin coat of carbon which reduces the intensity of the detected CL. Thus one takes a low mag image first, and high mag last, else the small ‘carbon contamination’ rectangle will sit in the middle of the low mag image, not desirable.
Applications-for optical microscopy where no SEM-BSE available Applications where SEM-BSE available Visualize the distribution of different phases that are otherwise similar, e.g. calcite and dolomite; 2 feldspars in granite Pinpoint the presence and location of small or rare minerals in a rock e.g. apatite in granite • Determine that different regions of the same mineral have a complicated history -- growth zonation; dissolution surfaces; healed cracks, e.g. carbonates, quartz, zircon, feldspar
These and the following CL images are mono-chromatic: only the total light intensity at each pixel is recorded by a photomultiplier. This is a common (simple/cheap) attachment for an SEM or microprobe. CL: defects in GaAs GaAs on Si for optoelectronic devices can have defects due to lattice mismatch between the film and Si substrate. The defects are not seen in SE image (top left). However, a CL image (bottom left) shows the areas of reduced strain, where a monochronometer collected 800 nm light. The right figure shows the CL spectra of strained (top) vs unstrained (bottom) material. Peter Heard, 1996, Cathodoluminescence--Interesting phenomenon or useful technique? Microscopy and Analysis, January, p. 25-27.
CL: quartz, zircon Images acquired with the Cameca CL (PM) detector. Left: quartz from Skye with complex history of growth or re-equilibration with hydrothermal system. Trace amounts of Al, Ti or Mn may be involved. Right: CL image of zircon from Yellowstone tuff (false color); adjacent BSE image (no zonation obvious). CL BSE CL (from research of Valley, and Bindeman and Valley)
CL image Using CL to Provide Necessary Details to Explain SIMS Isotope Data Here is a sample of an olivine rich chondrule from the Semarkona meteorite which contains unusual forsterite grains (dark grey BSE) that show both blue and red CL, enclosed in Al, Ca-rich glass (light grey BSE). Blue CL olivine at the rim is depleted in FeO (Fo>99.5) and enriched and enriched in refractory elements such as Al and Ca, while red CL olivine at core is slightly FeO-richer (Fo<99.5). Oxygen three isotope compositions of blue forsterite and glass are enriched in 16O relative to red forsterite. Note the glass emits green CL. CL Kita et al. (2007b) LPSC Abstract #1791
Carbonate CL with SEM…using filters One problem with some materials is that the luminescence has a finite persistence, so that a typical SEM scan causing streaking, as shown above left when dolomite (CaMg-carbonate) is imaged by SEM-CL (using no filter). Reed and Milliken showed that dolomite emits CL in 2 broad bands, one red and the other UV-violet, and that using a blue (transmission) filter elimated the red light which was causing the streaking. The above right image was acquired with a UV-blue filter. (20 kV) CL CL Reed and Milliken, 2003
CL Trace elements quenching CL Y P Th U CL • Sector zoning in Yellowstone Pre-LCT zircon • Bright CL: high P (and lower Y, U and Th) • Dark CL: high Y, U, and Th (compared to Bright CL area) CL Fournelle et al AGU 2000
Sample Prep: Epoxy and Abrasive Many (all?) epoxies produce CL: in color, dull green or blue. There are some minerals where any CL is totally quenched, and in grain mounts, the crystal is black CL surrounded by brighter epoxy! Common lapping and polishing abrasives (diamond, alumina, silicon carbide) emit CL! The sample must be well cleaned by ultrasonic treatment prior to examination Uncovered common glass microscope slides emit a dull blue CL CL CL In this false-colored monochrome image, the epoxy is emitting significant CL, intermediate in intensity to the zones in the zircon!
Cathodoluminescence image of zircon from Yakutian kimberlite (Russia) shows inherited core with thin oscillatory zoning overgrown by a homogeneous rim. CL CL Found on Web: Source, Bill Griffin, Elena Belousova; funded by Rio Tinto, BHP, Macquarie University
Class I: Native elements • Diamond • Class II: Sulfides • Sphalerite ZnS (important in phosphor industry) • Cinnabar HgS • Realgar AsS • Class III: Oxides • Periclase MgO • Spinel MgAl2O4 (synthetic only) • Corundum, Ruby, Sapphire Al2O3 • Cassiterite SnO2 CL in common minerals* -1 CL CL * Short list. Complete list in Marshall 1988
Class IV: Halides • Halite NaCl • Fluorite CaF2 • Class V: Carbonates • Calcite and Aragonite CaCO3 • Rhodochrosite MnCO3 • Witherite BaCO3 • Strontianite SrCO3 • Cerussite PbCO3 CL in common minerals* -2 CL CL * Short list. Complete list in Marshall 1988
Class VI: Sulfates, Tungstates • Barites BaSO4 • Anhydrite CaSO4 • Gypsum CaSO4-2H2O • Scheelite CaWO4 (a common EPMA focus mineral) • Class VII: Phosphates • Apatite (Ca5(P)4)3(F,Cl,OH) • Class VIII: Silicates • Quartz, Chalcedony, Tridymite, Cristobalite SiO2 • Feldspars CL in common minerals* -3 CL CL * Short list. Complete list in Marshall 1988
Class VIII: Silicates-continued • Scapolite • Kaolinite • Serpentine • Muscovite • Tremolite • Spodumene • Wollastonite • Benitoite BaTiSi3O9 - another EPMA bright light • Beryl CL in common minerals* - 4 CL CL * Short list. Complete list in Marshall 1988
Class VIII: Silicates-continued • Cordierite • Epidote • Olivine (Fe-free) • Andalusite, Sillimanite, Kyanite Al2SiO5 • Garnets - limited sightings • Zircon CL in common minerals* - 5 CL CL * Short list. Complete list in Marshall 1988