Challenges in Particle EPMA Analysis: The Good, the Bad, the Ugly
Learn about the complexities of electron probe microanalysis (EPMA) when analyzing particles, including issues with size, venue, and surface. Understand the differences between bulk and particle EPMA analyses, and explore various methods and approaches to improve accuracy.

Challenges in Particle EPMA Analysis: The Good, the Bad, the Ugly
E N D
Presentation Transcript
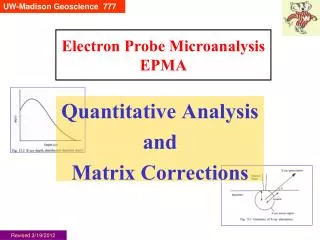
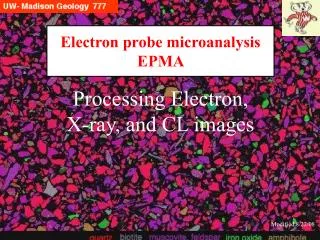
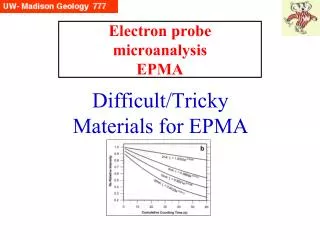
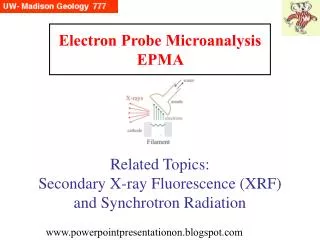
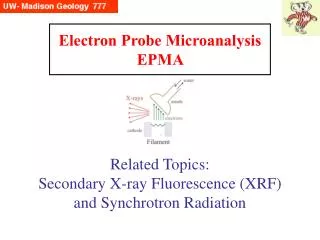
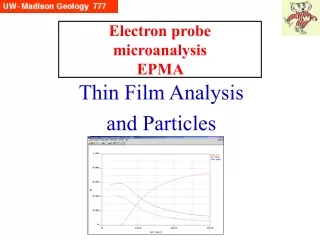
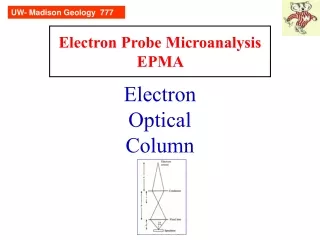
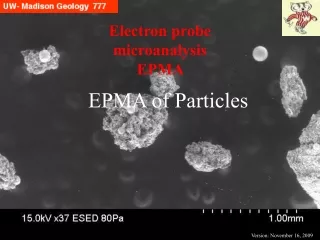
Electron probe microanalysisEPMA EPMA of Particles Version: November 16, 2009
What’s the point? EPMA is traditionally done for bulk material. What are the issues for particles? How precise/accurate are such analyses?
Bulk vs particle Normal EPMA assumes that the electron beam is exciting a homogeneous volume, i.e. there is no difference either laterally or vertically. Thus, the matrix correction is being applied in a uniform matter, and there is one applicable f(rz) profile for each element. However, particles create many difficulties, including: • Their size (small) • Their venue (location, surroundings) • Their surface (not flat nor smooth)
The Good, the Bad, the Ugly Most operators of electron microprobes, using WDS, understand the difficulties of trying to do EPMA on non-flat surfaces (particles). However, the real problem is that there are probably 100 EDS systems on SEMs for every 1 WDS on an electron microprobe. And with SEMs and EDS systems so easy to operate, a large number of users make major errors without knowing it, assuming whatever the software spits out as a composition is really what it is. After these slides, you should know the difference between the GOOD, the BAD, and the UGLY… particle analyses.
Size: “Mass Effect” Consider a 2 um diameter sphere (say of NIST glass K412). Mass effect/error: electrons escape from sides of small particles if the E0 is great enough so that electrons scatter out of the body before using up all their energy. Goldstein et al, 1992, p. 479, 481
Size: Absorption Effect Absorption effect of non-flat upper surface: there is a different path length from the normal flat geometry. In this case, the emergent x-rays will travel ~50% shorter distance in the material, and thus have ~50% of the absorption, and all else being equal, will yield a K-ratio twice as large as it would be if it were larger and had a flat polished surface. Goldstein et al, 1992, p. 479, 481
Size - Detector-sample Geometry EDS (shown to right): Variable effect of geometry of trajectory between beam impact area on non-uniform surface and the location of the detector. K-ratios from point 1 could be significantly different than those from point 3, despite the sphere being of uniform composition. WDS: Could be as bad, with up to 5 spectrometers positioned at 5 different orientations Goldstein et al, 1992, p. 479, 481
EDS vs WDS WDS 1 WDS 2 For all the problems cited, EDS has an advantage over WDS for “particle analysis” in that the spectrometer is in a constant position relative to the sample and beam “landing spot”, whereas WDS spectrometers would be at different positions, creating various different absorption path lengths to each spectromter.
How Do People Try to Do EPMA of Particles? Take whatever values come off the EDS with no correction other than built in ‘normalization to 100 wt%’; Overscan the sample; Put the beam on a top “flat” surface and hope for the best; Do #3 but apply Armstrong and Buseck’s geometric correction factors; Peak-to-background method; Do Monte Carlo simulations with DTSA-2 or PENEPMA and compare with actual K-ratios (time consuming); If large enough, mount, polish flat and do traditional WDS
Two approaches • Traditional approach: normalize numbers – but this is not very good (above left table) • Armstrong and Buseck (1975) developed a procedure based upon a regular geometric shape factor, where the different path length and other effects could be used. Method is based on bracketing particle and beam overscanning during collection of spectrum by EDS and modeling of electron path and x-ray propagation out through several shapes – sphere, hemisphere, squared pyramid, and rectangular, tetragonal, cylindrical and right triangular prisms. Correction factors are given in terms of predicted k-factors for pairs of particular elements, vs particle thickness along e beam. This is not easy, takes much trial and error, but apparently can yield fairly good results (see table above). Goldstein et al, 1992, p. 488, 489
Here is another useful way to view a lot of data: error histograms. The top one shows the “conventional” particle analysis procedure to be very inaccurate, whereas using their geometric-correction approach, the errors shrink greatly. Though there still are problems, which the analyst must recognize and report with any writeup. Armstrong-Buseck correction Goldstein et al, 1992, p. 490
Other approach: Peak/Background It is known that whereas geometric effects can create large differences in measured x-ray intensities, the ratio of a characteristic x-ray to the nearby background (=continuum of same energy range) intensity is less sensitive to geometric effects. Thus, an ‘automatic internal normalization factor’ can be created for both a standard and an unknown. This has been shown to work well. The issue then is to find software that has this implemented. This approach is discussed in Goldstein et al, 2nd edition, pp. 490-493. (It is also used in biological EPMA, where the beam can destroy the cellular material, so mass “disappears”.)
Other approaches: Peak/Background Results from using P/B approach for 2 minerals. Excellent results for the pyrite, better but not within the 1% error we would like to see. Goldstein et al, 1992, p. 491
Other approaches: Monte Carlo Simulations Another approach is to create a similar geometric shape, give it a composition which is what you believe the unknown to be (based upon initial EPMA results). In the model, you place the beam on a particular spot corresponding to where the beam hits it, and then “run the simulation” to create x-ray counts (and similarly for a standard), and then compare the resulting simulated K-ratio with the experimental K-ratio. If the K-ratios match, then the composition is correct; if not, modify the composition and run another simulation. Iterate until the simulated and the experimental K-ratios match.
Other approaches: Monte Carlo Simulations Nicholas Ritchie at NIST has upgraded the DTSA-II EDS program to include Monte Carlo simulation of EDS in various simple shapes http://nist.gov/dtsa
You then compare the EDS spectrum of the simulated material with the actual experimental acquired EDS spectrum DTSA-II http://nist.gov/dtsa
PENEPMA Another high powered EPMA simulation program is PENEPMA, developed by Salvat and Llovet at U of Barcelona. It includes secondary fluorescence, though is a bit more complicated than DTSA-II. It can be used to create X-ray spectra in complicated geometries.
Other Approaches to Particle Analysis Another use of SEM to identify particles is electron backscatter diffraction (EBSD) which can use the diffraction pattern (Kikuchi lines) to match a database of crystal lattice data to ID a particular phase, though not the exact chemical composition. For example, it can distinguish hematite from magnetite, but not the amount of say Ti or Mn present.
EBSD of Fe-oxide particles Electron backscatter diffraction (EBSD) allows diffraction (”Kikuchi”) patterns to be collected in an SEM, upon a sample surface tilting (70°) sharply away from the electron beam, collected with a special phosphor or cc detector, and then the pattern is compared with a set of possible matching crystal structures (all computerized, of course). A best fit (MAD < 0.5-1) is calculated if one of the structures can match for any possible orientation direction.
Here 6 bands were used to match a particle from the smoke stack of a steel mill, to hematite, with a fit (MAD) of .55
Other concerns regarding particles • If very fine (e.g. powder), difficult to disperse on a substrate, so different particle sizes and potentially different compositions are clearly separate • Difficult to apply conductive coat to side walls and underhangs, so that insulating materials will charge in high vacuum. Need to use rotating/swiveling coating attachment.
Ingredients: • A small container with tight-fitting lid (here, 8 oz) • Can of compressed air • Mount with sticky tape (here, 1 cm Al SEM mount) • Optional: something for mount to sit in/on so surface facing up (here: a large nut) Dispersion Technique-1 Step 1: Place a small amount of the powder/ small grains to be dispersed, along wall. Above, amount shown is really too much, use only a couple of grams of fine powder.
Step 2: Have already poked a small hole in the top, just large enough for the compressed air nozzle to stick through Step 3: Poke nozzle thru hole and give very brief (1/10 second) blast. Wait 10-30 seconds before opening the top to investigate (10 seconds for coarse particles, 30+ seconds for fine powder) Dispersion Technique-2
Results: nice dispersal of <1 - 15 um fly ash particles on carbon tape. If not dispersed, they would all be in a thick mass and difficult to clearly see the individual particles. Dispersion Technique-3
Inclusions = particles Plan View Cross section In a polished mount, there is a large flat surface, but we would consider small inclusions (at or less than the incident electron interaction volume) to be “particles”. Here, instead of being surrounded on the sides by air (or vacuum), and on the bottom by some substrate, the complication of having x-rays potentially from 2 masses is obvious.
Conclusion EPMA of particles • is increasingly being applied in many situations; • is not exactly straight forward; • does yield results with potentially large inaccuracies/ errors; • can only be considered qualitative, unless several careful steps are included