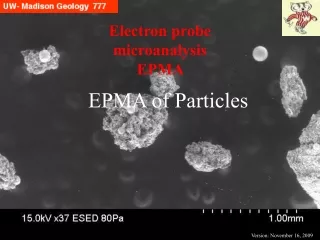
Electron probe microanalysis EPMA
Electron probe microanalysis EPMA. Difficult/Tricky Materials for EPMA. Some materials are somewhat to extremely difficult to do EPMA on. Guidance and passed on experience is very helpful And: How do you know something is tricky?. What ’ s the point?. Topics.

Electron probe microanalysis EPMA
E N D
Presentation Transcript
Electron probe microanalysisEPMA Difficult/Tricky Materials for EPMA
Some materials are somewhat to extremely difficult to do EPMA on. Guidance and passed on experience is very helpful And: How do you know something is tricky? What’s the point?
Topics Thin films and particles (discussed separately) Alkali-rich glasses Hydrous alkali-rich glasses Carbonates Hydrous phases (clays, micas, hydroxides, zeolites…) Apatite and similar non-isometric materials Porous materials Magnetic materials “Hot” (radioactive) materials “Hard to handle” (matrix correction) element pairs
What makes it difficult? Counts change over time Due to heating Due to charging Due to oxidation Counts change depending on crystallographic orientation Difficult to determine the element abundance Impossible to detect the element
Drop in Na Ka with counting time: weathered Ethiopian volcanic glass
The prior slide shows an example of “mobility” of some elements in insulating samples, in response to high energy electron bombardment in the electron probe. Alkali elements in glasses are particularly mobile. Jack Lineweaver at Corning in 1963, in studying the degradation on the inside surfaces of TV tubes, collected oxygen released due to the electron bombardment, seeing that it changed with time. J. Lineweaver (1963) Oxygen outgassing caused by electorn bombardment of glass, J. Applied Physics, 34, 1786-1791.
Lineweaver hypothesized that the 10 to 28 keV electrons travel thru the Al coating on the glass surface and are implanted into the glass at some depth, which then creates an electrical field which the Na atoms migrate toward. Non-bridging oxygen atoms then are freed to migrate to vacated positions nearer the surface and/or lose their electrons to the Al “electrode” and be released into the vacuum J. Lineweaver (1963) Oxygen outgassing caused by electorn bombardment of glass, J. Applied Physics, 34, 1786-1791.
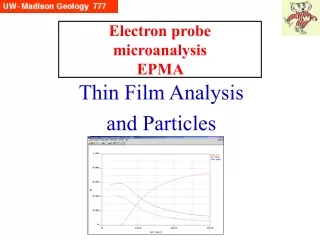
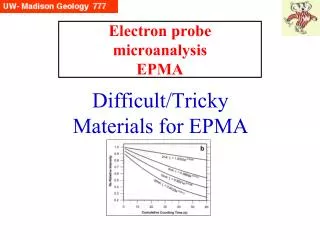
Hydrous alkali glasses: worst case scenario Morgan and London examined hydrous aluminosilicate glasses, which many volcanologists study, as “melt inclusions” trapped in minerals. Here, the dramatic drop in Na Ka counts versus time is shown. It is worst at 20 nA, and less at 2 nA (though still creates errors). Potassium also drops, though not as dramatically. Na G. Morgan and D. London, 1996, Optimizing the electron microprobe analysis of hydrous alkali aluminosilicate glasses, American Mineralogist, 81, 1176-1185.
Al The related phenomenon of “grow in” is shown to the right, with Al Ka showing the increase in counts with time more than Si Ka. Presumably, as the alkali atoms migrate deeper into the material toward implanted electrons, Si and Al atoms either migrate upward -- or maybe there just are just less “other” atoms for the beam to interact with. Si G. Morgan and D. London, 1996, Optimizing the electron microprobe analysis of hydrous alkali aluminosilicate glasses, American Mineralogist, 81, 1176-1185.
So how do you deal with this??? • There are several approaches: • Defocus the beam (reduce the impact) and do no correction (but you can’t do this with small melt inclusions) • Use a low current (reduce the impact) and do no correction (statistics will be poor) • Use a focused beam and high current and do a time dependent correction (but you have to have the software). Na • In a later paper*, Morgan and London further consider this; one conclusion being that 20 kV is better than 15 kV. * G. Morgan and D. London, 2005, Effect of current density on the electron microprobe analysis of alkali aluminosilicate glasses, American Mineralogist, 90, 1131-1138.
OK, but how to quantify the Water (in the Glass)? • There are several ways to go: don’t use EPMA, use FTIR or SIMS. But if you want EPMA, there are two options: • “Water by difference” where you assume the difference from 100 wt% is water + other volatiles (CO2, F, Cl and any other unanalyzed elements). This is not very precise and embodies all errors. • Measure oxygen, as suggested by Nash. However, this requires careful attention to carbon coating (must have same thickness as standards) plus problems with 2nd order Na Ka overlap on the O Ka peak. * B. Nash, 1992, Analysis of oxygen with the electron microprobe: applications to hydrated glass and minerals, American Mineralogist, 77, 453-457.
Sample Orientation Intensity Variations: F in Apatite Stormer et al. also showed that Ca Ka intensities in apatite also vary with time if the electron beam was perpendicular to the c axis, though in a somewhat more complicated way. J. Stormer, M. Pierson and R. Tacker, 1993, Variation of F and Cl X-ray intensity due to anisotropic diffusion in apatite during electron microprobe analysis; American Mineralogist, 78, 641-648.
Carbonates - Difficulties • EPMA of carbonates have always been difficult: • since C is not measured (nor O), there always is a very low total and so any errors are not immediately obvious. However, Probe for EPMA software does away with that issue. • beam currents of 10-20 nA will immediately cause apparent changes to the surface of calcite (in particular), e.g. black irregular area; whether this is a hole or build up of contamination, is not clear to me (I suspect the former) • I have always “gotten by” with using very low beam currents (1 nA) and a defocussed (10-20 um) beam which seemed to give satisfactory results for calcite • However, I have always wondered “why”…
Carbonates - Difficulties But with the TDI ability with Probe for EPMA, I have started to investigate this -- here 15 kV with 20 nA …hmmm….not at all what I expected, which would have been dropping Ca…but it is increasing…and the O has a periodic behavior, dropping over the first 20 seconds then oscillating a bit…
Carbonates - Difficulties Dolomite seems somewhat similar, though less extreme at first glance, both cations Ca and Mg increase (though some of the up and down behavior), and O drops as before then rises … so similar in general. Obviously only by using a very similar standard to the unknown, would you have any chance of getting a decent EPMA result.
Beam sensitive samples: require care, such as lower current (e.g. 1-6 nA) and defocused beam (10-25 mm), or a correction for count drop (“TDI” correction in our Probe for EPMA software): In addition to what was discussed previously, also: • Alkali feldspars, particularly albite: Na counts drop • Apatite: not as fragile, but some grains will crater with moderate currents (60 nA) after 40-60 seconds.
Oxidation of iron in basaltic glasses: Fialin et al (2001) reported that high electron dose (130 nA, less than 30 um diameter) led to oxidation. This was in reference to a study of Fe L/L as indicator of Fe-oxidation state. Presumably this is along the lines of the studies referred to before, where oxygen migrates to the surface of the glass. Fialin et al, 2001, Fe3+/Fe vs Fe L peak energy for minerals and glasses: recent advances with the electron microprobe, American Mineralogist, 86, 456-465.
Beam deflection: magnetic specimens (e.g. some Ni-Mn compounds) apparently deflect the electron beam, as seen by contamination spots in the optical image offset from ‘normal’ incident position (which would affect the Rowland Circle orientation). Limited experience suggests that carbon coating as well as being rigorous in using a constant magnification (for all standards and unknowns) may help. Not much has been published on this. • I attempted to make “mu metal” shields to place over the specimen (with hole for beam to hit the sample), but the metal was too thick and blocked the take off angle of the x-rays.
Porous Material: Heterogeneous Catalysts Many catalysts consist of a number of active metals and promoters in a porous ceramic support material. However, EPMA assumes a dense bulk material, such as the standard used. Lakis et al studied this, creating two end member analog materials: one conductive (Ag), one insulating (Al2O3). Below are 4 versions of the alumina of varying densities: from left to right: 100%, 87%, 77%, 57% R. Lakis, C. Lyman and J. Goldstein, 1992, Electron-probe microanalysis of porous materials, Proc. 50th Ann. Mtg. Electron Microscopy Soc. Am., p. 1660-1661.
Porous Material: Heterogeneous Catalysts They observed that with decreasing density, the K ratio relative to solid standard decreased. To remove the effects of surface roughness, the “peak to background” method was used; this assumes both the characteristic and continuum x-rays are equally affected by geometric effects. This produced good results for Ag, but not for the alumina, with Al and O x-rays acting differently. They hypothesized that electric field in the material was not linear and yielded different x-ray general volumes for each x-ray.
Even more basic: does coating an insulator really deal with the fundamental problem of electrons being introduced into a non-conductive material? In the 1991 book Electron Probe Quantitation*, Bastin and Jeijligers discussed this in their chapter “Nonconductive specimens in the electron probe microanalyzer -- A hitherto poorly discussed problem”. After many experiments, some using metallic coatings on insulators, they warned that using metallic coatings is not a solution, and said where possible “ try to analyze either without a coating at higher voltages or to burn a hole ina carbon coating. A closed coating is probably too dangerous because small differences in (carbon) coating thickness would produce large differences in oxygen coat rates due to the excessive absorption of O Ka x rays in carbon.” They mention Cazaux’s 1986 paper where he tossed out the idea that it might be better to make thin films of materials and apply conductive coating to the bottom surface, not the top. * Published by Plenum Press, Editors K. Heinrich and D. Newbury
EPMA of “hot” materials Far left: Front view of a hot cell with operator working remotely. (French Atomic Energy Commission) Left: General view of shielded probe and box in dedicated hot cell (front wall in concrete moved to allow viewing of the probe) EPMA is used to characterize nuclear fuel’s fission products produced by fissile atoms (U, Pu) and the neutrons. However, the special character of the hot fuel creates problems for the tradition electron probe, and so it must be modified, both to protect the operator, and to shield the detection system from the inherent radiation coming from the material. J. Lamontagne, T. Blay and I. Roure (2007) Microbeam Analysis of Irradiated Materials: Practical Aspects; Microscopy and Microanalysis, 13, 150-155.
Shielding the detectors A shielding of heavy metal is used to prevent and particles from the samples from hitting the detectors. Far left: Schematic of a typical electron probe. Left: Inside view of spectrometer with shielding close to column window to prevent direction radiation from chamber from hitting the detector. Also shield along back of detector (vs ricocheting ?)
Problems with ‘hot’ analyses Xe x-ray map @ 15 kV There are at least 2 problems for quant analysis: even with shielding there is a highcurved background (above left) and low abundance (~1 wt% ea) elements of interest (Nd, Xe, Mo, Ru, Te, Tc, Zr, Cs) require high beam currents (eg. 250 nA @ 15 kV) for 10 second counting times. Also, Xe bubbles in the material are difficult to measure: those at the surface have been popped open and the gas lost; those below the surface may require higher (25 kV) E0. And there is no Xe standard, requiring ingenuity!
Hard to figure out which matrix correction is right! • Very little (no?) guidance exists in the literature about the problem of materials composed of extremes of Z-number elements. • Armstrong and Carpenter reported an issue at the Cal Tech EPMA lab years ago for a Si-Ir unknown. Using pure Si and Ir standards, they concluded the sample was either Si55Ir45 or Si50Ir50, depending upon which one of 8 matrix corrections was used. • This problem has several parts: • Incorrect calculation of the alloy’s mean atomic number (Z), a point of controversy highlighted for extreme differences in Z • Failure to include continuum fluorescence esp. a problem for high Z elements • Possible error in the mass absorption coefficients
Hard to figure out which matrix correction is right! Solution: Use a std similar to the unknown! Then all 3 issues disappear Example: A few years ago we had some Ni-Al-Pt alloys to analyze, but just as the CalTech people had, we got different answers using pure element stds, for different matrix corrections (top 4 lines below): Zhu, Zhang, Ballard, Martin, Fournelle, Cao, Chang, 2010, Study of the Ni-rich multi-phase equilibria in Ni-Al-Pt alloys using the cluster/site approximation for the FCC phases, Acta Materialia, 58, 180-188.
Hard to figure out which matrix correction is right! I asked the grad student if there was any single intermediate alloy in the system that was homogeneous that could be used as a standard, and he said yes, so we used that as the standard, which yielded the improved numbers shown at the 2nd half below: Zhu, Zhang, Ballard, Martin, Fournelle, Cao, Chang, 2010, Study of the Ni-rich multi-phase equilibria in Ni-Al-Pt alloys using the cluster/site approximation for the FCC phases, Acta Materialia, 58, 180-188.
Bottom line: Always hope for the best (simple, easy to do EPMA) but beware that more often than not, many materials may have issues, so if you get “poor results”, more time may be required to unravel the issues. And always ask questions to those with “more experience” as they may have some insights….