NCAR Initiative on Weather and Climate Impact Assessment Science Extreme Events
590 likes | 817 Vues
NCAR Initiative on Weather and Climate Impact Assessment Science Extreme Events. Linda O. Mearns NCAR/ICTP MICE Poznan, January 2004. Elements of the Assessment Initiative www.esig.ucar.edu/assessment. Characterizing Uncertainty in Assessment Work Extreme Events

NCAR Initiative on Weather and Climate Impact Assessment Science Extreme Events
E N D
Presentation Transcript
NCAR Initiative on Weather and Climate Impact Assessment Science Extreme Events Linda O. Mearns NCAR/ICTP MICE Poznan, January 2004
Elements of the Assessment Initiative www.esig.ucar.edu/assessment • Characterizing Uncertainty in Assessment Work • Extreme Events • Attribution in Climate Impacts: • Establishment of a Climate/Human Health Program
Extreme Events “Man can believe the impossible. But man can never believe the improbable.” - Oscar Wilde
Extreme Events Goal Integratedifferent aspects of research in weather and climate extremes. • Atmospheric science (processes and modeling) • Statistical aspects of extremes • Societal impacts and vulnerability
The Weather and Climate Extremes Atmospheric Processes Modeling of Extremes Trends in Observations Weather Climate Change Impacts and Vulnerabilities Extreme Value Theory
Atmospheric Processes and Modeling of Extremes • Research in the physical processes of extremes: (e.g., warm season heavy rainfall - see new hydrologic cycle initiative) • Modeling of extremes - • Regional climate and mesoscale model validation - how well models produce extremes. • What improvements in parameterization of convection can be made specifically for improving extremes. • Spatial scaling of extremes - point support versus area support. • Projections of changes in extremes with climate change. • Downscaling of extremes
Application of Extreme Value Theory • Preliminary analysis of weather and climate variables (and their impacts) regarding suitability of using heavy-tailed distributions. • Reexamination of trends in extremes (temperature and precipitation) - allowance for heavy tailed distributions. • Application in climate change projections. • Application to other types of extremes, (e.g., icing, turbulence, wind shear).
Extreme Value Theory for Climate and Climate Impacts “It seems that the rivers know the [extreme value] theory. It only remains to convince the engineers of the validity of this analysis.” –E. J. Gumbel • Distributions • Heavy-tailed: “surprises” that should not be surprising. • Statistical Downscaling • Can extremes be downscaled? (Unify downscaling and extreme value theory)
Societal Impacts of and Vulnerability to Extremes • Identification of extremes significant to society • Modeling of impacts of extreme events • Reducing societal vulnerability to extremes • Understanding vulnerability requires knowledge of the behavior and interactions of all systems involved in an extreme event. • E.g., town storm flood • culture meteorology hydrology
Fort Collins Flood, July 1997 Heaviest rains ever documented over an urbanized area in Colorado (10 inches in 6 hours). 5 dead, 54 injured, 200 homes destroyed, 1,500 structures damaged. These locations were not in 500-yr floodplain.
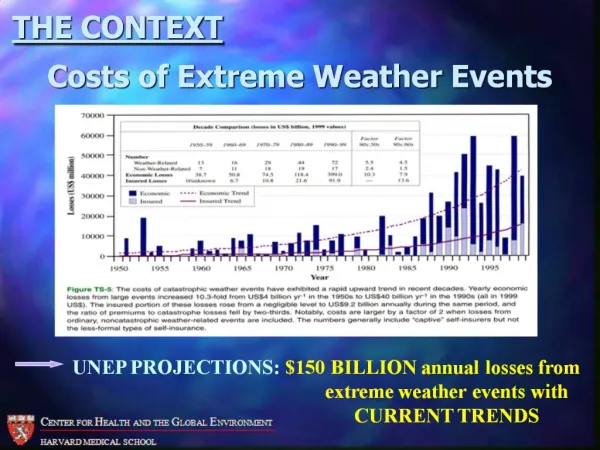
Anticipating Hurricane Damages This figure shows that the upper tail of the distribution of economic damage from hurricanes may be heavier than commonly assumed (i.e., storms with high damage are not as unusual as conventional analyses would indicate). Katz, R.W., 2002: Stochastic modeling of hurricane damage. Journal of Applied Meteorology, V. 41, pp. 754-762.
Extremes Projects
Extreme Events in Climate Models and Spatial Scaling …to analyze the frequency and intensity of various extreme events particularly relevant to climate impacts in regional and global climate models. Extreme value theory will be used in these analyses. In addition we will undertake a detailed robust examination of the spatial scaling characteristics of extremes in climate models NCAR Team: R. Katz, J. Meehl, D. Nychka, R. Wagoner, J. Coen, R. Rasmussen, M. Moncrief, C. Tebaldi External Collaborators: R. Smith, U. of N. Carolina, P. Naveau, U. of Colorado
Extremes from Climate Model Projections Number of frost days within a year is a useful indicator for determining agricultural impacts and also is a more extreme measure of climate variability NCAR Team: C. Tebaldi, G. Meehl
Model vs. Data:Changes in frost days in the late 20th century show biggest decreases over the western and southwestern U.S. in observations and the model
Future changes in frost days from the climate model show greatest decreases in the western and southwestern U.S., similar to late 20th century
Large-scale changes in atmospheric circulation affect regional pattern of changes in future frost days Anomalous ridge of high pressure brings warmer air to northwestern U.S., causing relatively fewer frost days compared to the northeastern U.S., where an anomalous trough brings colder air from north H cold L warm
Spatio-temporal Aspects of extremes P. Naveau and R. Smith Weather Stations Y Proximity between weather stations: => similar extremes Isolated weather station: => inference more difficult X Extremes = Rare events Necessity of a spatial approach Better estimation of scale parameter of the GPD Better return levels
Climate Modeling of Extremes GP = Generalized Pareto CO2 increase CLIMATE VARIABILITY ? Climate models GP ? Random cascade (spatial structure) + GP Point Processes (spatial structure) ? ? Precipitation GP ? Network runoff model ? FLOODS GP
Extremes in Aviation-Related Weather ….apply extreme value theory to four forecasting problems of particular relevance to aviation • In-flight Icing • Turbulence • Convection • Public Weather Forecasting • First three occur very infrequently – less than 5% at a time over continental US NCAR Team: Barb Brown, Marcia Politovich, R. Katz, E. Gilleland, G. Young
Photo courtesy of NASA GRC Icing Severity as an Extreme Value Problem Marcia K. Politovichand Barbara G. Brown NCAR RAP Apply extreme value method for icing severity in an experimental version of the Integrated Icing Diagnosis/Forecast Algorithm.
Basics • Icing is a high-impact phenomenon that is very difficult to diagnose or forecast • Forecasting icing severity is even more critical – and difficult • Extreme value theory provides one avenue…
How is severity defined? Trace: Ice becomes noticeable. Rate of accumulation is slightly greater than the rate of sublimation. Light: The rate of ice accumulation may require occasional use of ice protection systems to remove/prevent accumulation. Moderate: The rate of ice accumulation is such that frequent use of ice protection systems necessary. Severe: The rate of ice accumulation is such that ice protection systems fail to remove the accumulation of ice.
What are characteristics of PIREPs? • Subjective (pilot and aircraft dependent) • Non-systematic • Relatively few negative reports • They occur where airplanes are • Most common in regions around airports • Process is not automated
How rare (or extreme) an event is icing, according to PIREPs?
What is our approach? • Identify clues to icing severity • Factors and combinations of factors that have a physical and statistical relationship with observed severity • Connect to PIREP observations • Connect to research aircraft observations • Use clues to develop extreme value model of icing severity
What are some of the clues? • Model output: temperature, humidity, cloud parameters, winds, … • Surface observations: precipitation type, temperature, dew point, and trends • Radar • Satellite (vis and IR) • IIDA, IIFA
Extremes Toolkit ….designed to facilitate the use of extreme value theory in applications in weather and climate problems – oriented toward the nonexpert • Tutorial document including examples • GUI based - programming not required • Fits data to extreme value distributions • Estimates return values with uncertainty measures • Allows for trends, annual cycles, etc. • www.esig.ucar.edu/extremevalues/extreme.html NCAR Team: R. Katz, E. Gilleland, G. Young, D. Nychka Acknowledgments: S. Coles
Influence of Climate Variability and Uncertainty on Flood Hazard Planning in Colorado …to enhance the understanding and use of flood-related climate information in floodplain management in the Colorado Front Range. Project Components: • Policy and decision making • Weather and climate extremes diagnostics • Hydrological modeling • Impacts of flood hazard planning NCAR Team: M. Downton, R. Morss, O. Wilhelmi External Collaborators: Eve Gruntfest, U. Colorado, Colorado Springs
Influence of Climate Variability and Uncertainty on Flood Hazard Planning in Colorado Standard tool for assessing flooding hazards is the Colorado Precipitation-Frequency Atlas for the Western US, NOAA (1973), giving contours of rain rates for various return periods. The atlas has few measures of statistical uncertainty NCAR Team: M. Downton, M. Crandell, O. Wilhelmi, R. Morss, U. Schneider, E. Gilleland
Extremes Analysis of Boulder Daily Precipitation • Simplest analysis is fitting a generalized extreme value distribution to the annual maxima • An exceedance over threshold model can account for seasonality and other covariates • A common summary is the return time: • e.g., the size of an event whose average time to occur is 100 years
Managing Wildland Fire Risks: Climate and Weather Information,Extremes and Uncertainty …to contribute to the development of a methodology for examining the effects of uncertainty and the value of weather and climate information for the effective management of wildland fire risks. NCAR Team: K. Miller, R. Katz, R. Wagoner External Collaborators: A. Cullen, U. of Washington; S. Kane, NSF
Downscaling of Extreme Weather/Climate Phenomenon …to downscale severe thunderstorms (those containing large hail, strong wind, or tornadoes) using upper air variables from reanalysis, regional models, and global models. NCAR Team: J. Bresch, R. Katz External Collaborators:H. Brooks, NOAA/NSSL, C. Anderson, Iowa State U.
Estimating Severe Thunderstorm and Tornado Climatology • Relationships between observed weather and observed and reanalysis soundings from US, east of Rocky Mountains • Apply results to global NCAR/NCEP reanalysis • Every other grid point over non-water, non-ice locations, one time per day • 1997-1999 • Uses sounding time closest to late afternoon
Estimating severe thunderstorm and tornado climatology • Severe thunderstorms with at least 5 cm hail, 120 km/h wind gusts or F2 or greater tornado (~10% biggest events in US) • Severe occurrence related to Sfc-6 km vertical shear of horizontal winds and convective available potential energy (cape) • Tornado occurrence (conditional on severe occurrence) based on Sfc-1 km vertical wind shear and lifted condensation level
Cautionary notes • Pattern is important, not the magnitude • Result is for favorable environments • Storms may not initiate at all • Probability of severe occurring, given all the ingredients =6.0% • Probability of severe occurring, given no ingredients=0.06% • Tornado environments may be biased towards large outbreaks (shifted a little too far east in US)
Future plans • Look at all soundings from reanalysis • Trends? • Interannual variability • Do same with global climate models, regional climate models, scenarios of future climate
Analysis of Extreme Wind Events in Northern Alaska …as part of an integrated assessment of impacts of climate variability on the north slope of Alaska, analyze damaging extreme wind events associated with storms. Determine trends in extremes using extreme value theory and explain presence of trends. NCAR Team: L. O. Mearns, M. Pocernich, C. Tebaldi External Collaborators: M. Lynch, U. Colorado
Extreme Value Statistics To estimate the return level and frequency of high wind events, extreme value statistics are used. This involves estimating the parameters of the Generalized Extreme Value (GEV) distribution. These analysis have been performed by season. Tasks that will be addressed in the study include • Analyse the wind data for the presence of trends with respect to time. • Seek covariates or other dependent variables to explain the presence of trends.
Wind at Barrow Alaska - Data sources Hourly data from the NWS (1945 - 2002). When the data was collected with greater frequency, only one observation was taken per hour. Daily statistics - To summarize the hourly data on a daily basis, the following statistics were used. Maximum daily wind-speed 75th percentile daily wind-speed. Since periods with sustained winds appear to cause the greatest damage, this was done to capture days with a greater duration of high winds.
Wind Speed Barrow, Alaska 75th Percentile Daily Wind speed – max monthly values
Seasons Analyses were performed using the following definition of seasons. Winter - November to March Spring - April and May (Spring Whaling) Summer - June to August Fall - September and October (Fall Whaling)