Download
1 / 51
510 likes | 635 Vues
NCAR Initiative on Weather and Climate Assessment Science. Linda O. Mearns Doug Nychka and Jerry Meehl (acting co-directors). Overarching Goals of Assessment Initiative. Develop new programs that address research gaps in Impact Assessment Science and that leverage expertise at NCAR.

E N D
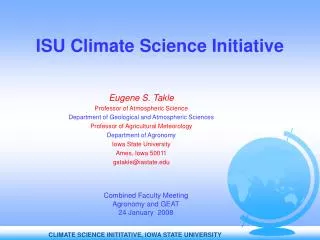
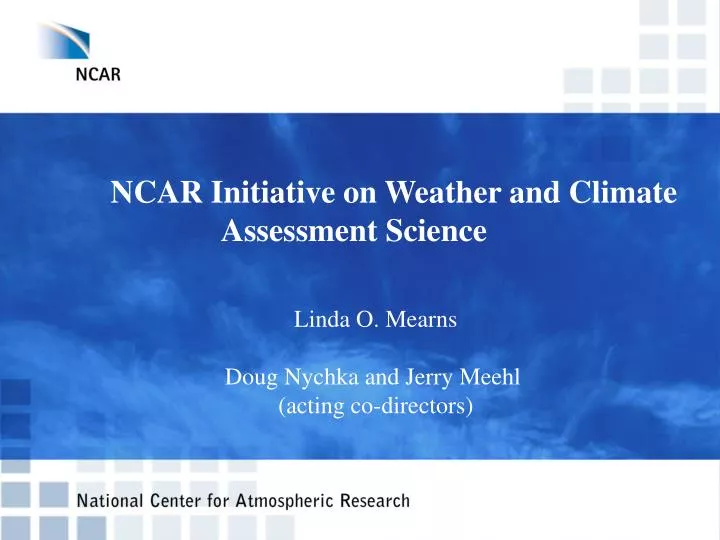
NCAR Initiative on Weather and Climate Assessment Science Linda O. Mearns Doug Nychka and Jerry Meehl (acting co-directors)
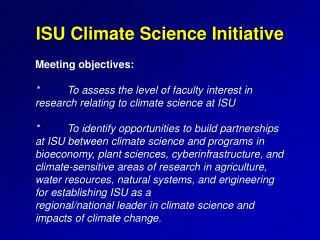
Overarching Goals of Assessment Initiative • Develop new programs that address research gaps in Impact Assessment Science and that leverage expertise at NCAR. • Emphasize themes that integrate research across NCAR divisions. • Foster NCAR’s leadership role in the IPCC and other national and international efforts related to assessment. • Create feedback between the impact and assessment communities and the geophysical modeling programs
MainInitiativeThemes • Characterizing Uncertainty in Assessment Work • Modeling and Assessment of ExtremeEvents • Establishment of a Climate/Human HealthProgram
Initiative Management L. Mearns, Director B. Harriss V. Holzhauer G.Meehl and D. Nychka W. Washington Administrator Acting Co-directors Mentors Advisory Board G. Bonan, B. Brown, R. Katz, K. Miller, R. Morss, T. Wigley Cyber/infrastructure, Biogeosciences, Data Assimilation, GIS, Water Cycle, Wildfire. Initiative Representation
Characterizing Uncertainty in Assessment Work “To know one’s ignorance is the best part of knowledge” - Lao Tzu “Doubt is not a pleasant condition, but certainty is an absurd one” -Voltaire
Projections of Future Climate T ??P Uncertainty due to spatial scale T ?P T P Uncertainty Temperature Precipitation
3000 2500 A1F1 2000 High > 1800 GtC A2 Medium High 1450-1800 GtC A1B 1500 Total Cumulative Carbon Dioxide Emissions (GtC) Medium Low 1100-1450 GtC B2 A1T 1000 Low < 1100 GtC B1 500 IS92 Range 0 1990 2000 2010 2020 2030 2040 2050 2060 2070 2080 2090 2100 Cumulative Emission 1990-2100, CtC
Characterizing Uncertainty in Assessment Work • Climate projections and scenarios • Emissions and land processes • Impacts models (e.g., agriculture and ecosystem models) • Environmental data sets (e.g., climate observations, climate proxy data, soils) • Uncertainty and decision making
Uncertainty and Decision Making (some details) • Role of different types of uncertainty in different phases of the policy decision process. • Uncertainty and multiple decision makers in resource management. • Understanding policy makers' needs for quantification of uncertainty and adapting the analysis of climate projections and scenarios to address these needs. • Economic value of reducing uncertainty in weather and climate information.
Extreme Events “Man can believe the impossible. But man can never believe the improbable.” - Oscar Wilde
Heaviest rains ever documented over an urbanized area in Colorado (10 inches in 6 hours). 5 dead, 54 injured, 200 homes destroyed, 1,500 structures damaged. Fort Collins Flood, July 1997 These locations were not in 500-yr floodplain.
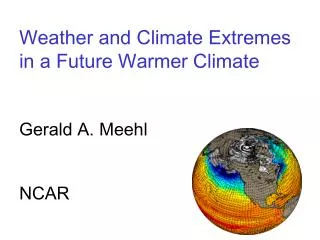
Weather and Climate Extremes Atmospheric Processes Modeling of Extremes Extremes toolkit Trends in Observations Weather Climate Change Impacts and Vulnerabilities Extreme Value Methodology
Extreme Events Integratedifferent aspects of research in weather and climate extremes: • Atmospheric science (processes and modeling) • Statistical aspects of extremes • Societal impacts and vulnerability
Atmospheric Processes and Modeling of Extremes • Modeling of extremes • Regional climate and mesoscale model validation - how well models reproduce extremes. • Spatial scaling of extremes - point versus area average. • Projections of changes in extremes with climate change. Research in the physical processes of extremes (e.g., warm season heavy rainfall – requires partnership with Water Cycle Initiative)
Application of Extreme Value Methodology Normal Max 100 Normals • Analysis of weather and climate variables in terms of tail events and their properties at different spatial scales. • Trend analysis of extremes (e.g., temperature and precipitation). • Spatial dependence of extreme events.
Societal Impacts of and Vulnerability to Extremes • Identification of extremes significant to society • Modeling the impacts of extreme events • Tools to reduce societal vulnerability to extremes • Understanding vulnerability requires knowledge of the behavior and interactions of all systems involved in an extreme event • e.g., town storm flood • economics meteorology hydrology
Climate/Health Program Interdisciplinary Community Integrated Approach Physical Biological Data Rescue and Archive Design Analysis • Hydrology • Oceanography • Climatology • Ecology • Entomology • Microbiology • Mammalogy Program Modeling and Prediction Vulnerability and Risk Assessment Social • Public Health • Demography • Economics • Sociology Observation Monitoring Surveillance Analytical Studies
Uncertainty due to land cover changes Sensitivity and scaling of climate model results Combining multi-model ensembles Initiative Highlights Uncertainty
Change in frost days in climate projections 24-hour precipitation extremes and flood planning (also a use of the Extremes Toolkit) Extremes
Land Cover Forcing from SRES Scenarios in Climate Models How do changes in land use and land cover alter climate projections? NCAR Team: G. Bonan, L. Mearns, J. Meehl, K. Oleson External Collaborators: J. Feddema, U. of Kansas, R. Leemans, M. Schaeffer, RIVM, Netherlands
Potential (or Natural) Vegetation Impact of Croplands on Climate IMAGE 1970 Land Cover • Model Experiments • Multi-decadal climate model simulations with the Parallel Climate Model (Washington & Meehl) • Uses NCAR LSM as land surface model • One simulation with potential vegetation • Another with 1970 (present-day) land cover
Climate Change From Present-Day Croplands Summer (JJA) Daily Maximum Temperature (40 Year Average) Present Day Land Cover – Natural Land Cover • Decreased daily maximum temperature in June-August of present-day croplands compared to natural vegetation • Due primarily to higher albedo of croplands, but also to changes in evapotranspiration
Transient Climate Change Simulations Currently In Progress: Transient climate simulations from 1870-2100 using historical and future land cover change
Sensitivity of Climate Models to Natural and Anthropogenic Forcings • Paleo-climate simulation using Paleo-CSM to test the validity over a long integration period • Designed suite of forcings to probe model sensitivity for the 20th century • Scaling of models to new forcings NCAR Team: C. Ammann, G. Meehl, C. Tebaldi, B. Otto-Bliesner, E. Wahl Outside Collaborators: P. Naveau (CU), N. Graham (Scripps/HRC), M. Mann (UVA), P. Jones (CRU-UK), H.-S. Oh (UAlberta), F. Joos, C. Casty, J. Luterbacher (UBern), J. Bradbury, R. Bradley (UMass), K. Cobb (CalTech)
Climate models with only “natural” forcings (volcanic and solar) do not reproduce observed late 20th century warming When increases in anthropogenic greenhouse gases and sulfate aerosols are included, models reproduce observed late 20th century warming Years 20th Century Climate
Scaling of Climate Models Pilot project uses PCM results from the B2 scenario and scales to the A2 scenario using a simple linear regression Here the regression coefficient is based on the global mean temperature estimated (usually by an energy balance model) for the A2 scenario. A key statistical challenge is to characterize the error in this method.
Scaled spring precipitation field for A2 scenario Actual climate projection Error field scaled by natural variability
Scaling Errors as a Function of Resolution Relative RMS errors for different grid box sizes
How do we combine the results of several climate models to make inferences about changes in regional climate ? NCAR Team: C. Tebaldi, D. Nychka, G. Meehl External Collaborators: R. Smith (UNC)
Central Asia used as an example Regional Statistical Analysis 9 AOGCM Projections A2 Scenario Regional Inference for Climate Change Circa the Third Assessment Report
e = m + X j j = n + e Y j j Combining Multi-Model Ensembles Consider the results of several models as a sample from a hypothetical super population of models: j= 0: observed data j=1, M: the M models X: current climate Y: future projection mand n :true values The variance in the errors is determined based on principles of model bias and model convergence
Posterior Distributions for Current and Future Winter Temperatures (DJF) for Central Asia °C
Multivariate Model - Pooling Uncertainties °C Regions
Extremes from Climate Model Projections Number of frost days within a year is a useful indicator for determining agricultural impacts and also is a more extreme measure of climate variability NCAR Team: C. Tebaldi, G. Meehl
Model vs. Data:Changes in frost days in the late 20th century show biggest decreases over the western and southwestern U.S. in observations and the model
Future changes in frost days from the climate model show greatest decreases in the western and southwestern U.S., similar to late 20th century
Large-scale changes in atmospheric circulation affect regional pattern of changes in future frost days Anomalous ridge of high pressure brings warmer air to northwestern U.S. causing relatively less frost days compared to the northeastern U.S. where an anomalous trough brings colder air from north H cold L warm
Extreme policy and decision making Precipitation event analysis Impacts of flood hazard planning Influence of Climate Variability and Uncertainty on Flood Hazard Planning in Colorado Standard tool for assessing flooding hazards is the Colorado Precipitation-Frequency Atlas for the Western US, NOAA (1973), giving contours of rain rates for various return periods. The atlas has few measures of statistical uncertainty NCAR Team: M. Downton, M. Crandell, O. Wilhelmi, R. Morss, U. Schneider, E. Gilleland External Collaborators: P. Naveau (CU), R. Smith (UNC), A. Grady (NISS)
Extremes Analysis of Boulder Daily Precipitation • Simplest analysis is fitting a generalized extreme value distribution to the annual maxima • An exceedance over threshold model can account for seasonality and other covariates • A common summary is the return time: • e.g., the size of an event whose average time to occur is 100 years
Decision making in resource management – water resources Quantification of uncertainty in regional climate change projections Climate/health issues Integration Across Uncertainty
Project to Identify Impacts of Global Climate Change on Water Utilities (K. Miller and D. Yates). Use a “primer on climate change” and a workshop (Spring ’04) as vehicles to elicit feedback from managers on multi-model statistical summaries. These results will be used to modify the statistics. American Water Works Research Foundation Collaboration with NCAR
%PCP, DJF ΔTemp, DJF Water Resources Assessment WNA ΔTemp, JJA %PCP, JJA Sacramento CC scenar JJA C hist DJF hist mm CC scenar Statistical Downscale (Yates et al. 2003) JJA San Joaquin C DJF mm Global Regional
Climate/health issues integrate well with other parts of the Initiative Both temperature and precipitation extremes are important contributors to problems in human health Many important issues of uncertainty in attribution of climate as a cause of health problems (e.g., vector-borne disease) Climate/Health