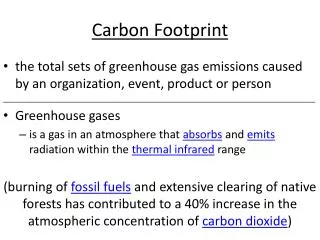
Carbon Footprint of University-Managed Travel During 2008 Fiscal Year
80 likes | 374 Vues
Carbon Footprint of University-Managed Travel During 2008 Fiscal Year Alex Clark Stephen Feinberg Mark Henson Janna Lambson Kharel Thompson Introduction Objectives:

Carbon Footprint of University-Managed Travel During 2008 Fiscal Year
E N D
Presentation Transcript
Carbon Footprint of University-Managed Travel During 2008 Fiscal Year Alex Clark Stephen Feinberg Mark Henson Janna Lambson Kharel Thompson
Introduction Objectives: • Find carbon dioxide emissions due to university managed travel (university sanctioned trips by faculty, staff and students) during the 2008 fiscal year, and explain the drivers for this kind of travel. • Use this knowledge to determine which activities should be targeted to efficiently reduce emissions. Methodology: • Categorized activities for which data was obtained into four categories: Business trips flown, student study abroad trips flown, business trips driven, and drives to the airport.
ResultsFull Causality numbers in the model Pop, Activity, Fuel, Carbon
Number of Trips Number of Trips Tot/Avg Distance
Data for Study Abroad/Faculty Air Travel http://capitawiki.wustl.edu/EECE449/images/5/52/Data3.xls
Conclusions and Future Directions • 11,259,977 kg carbon dioxide emitted during FY2008 as a result of university-managed travel • Most prominent carbon-emitting activities were faculty/staff business trips, both flown and driven • Holes: many specific activities left out due to lack of data; data insufficient to trace most miles traveled back to an activity; miles driven for business trips had to be extrapolated • Possible improvements: improve accounting methods • Future directions: Integrate commuting and university-managed travel data; validate results