Washington State Drug Mortality
160 likes | 217 Vues
A presentation about Washington State Drug Mortality Statistics by County. https://gettreatment.com/find-treatment-by-state/washington-drug-and-alcohol-treatment-centers

Washington State Drug Mortality
E N D
Presentation Transcript
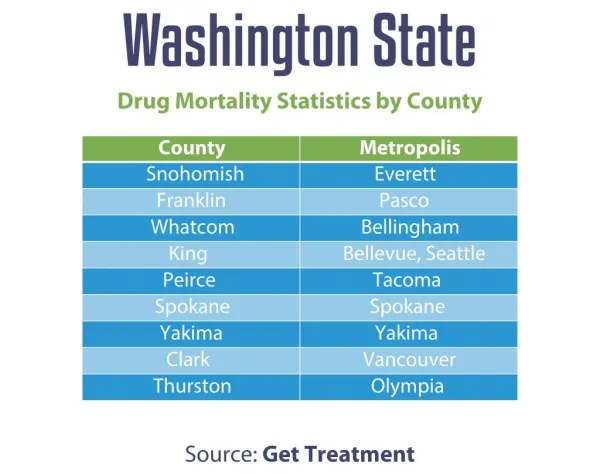
Washington State Drug Mortality Statistics by County County Snohomish Franklin Whatcom King Peirce Spokane Yakima Clark Thurston Metropolis Everett Pasco Bellingham Bellevue, Seattle Tacoma Spokane Yakima Vancouver Olympia Source: Get Treatment
Drug Poisoning Mortality in Snohomish County (855) 638-9268 23 Estimated Age-adjusted Death Rate 21 19 per 100,000 people 17 15 13 11 9 7 1999 2000 2001 2002 2003 2004 2005 2006 2007 2008 2009 2010 2011 2012 2013 2014 2015 Sources: CDC, Get Treatment
Snohomish County Drug Deaths by Age Group (855) 638-9268 50 2011 2012 2013 2014 Number of Deaths 38 25 13 0 <19 20-29 30-39 40-49 50-59 60+ Age Group Sources: Medical Examiner, Get Treatment
Drug Poisoning Mortality in Thurston County (855) 638-9268 16 Estimated Age-Adjusted Death Rate 14 Per 100,000 People 12 10 8 6 4 1999 2000 2001 2002 2003 2004 2005 2006 2007 2008 2009 2010 2011 2012 2013 2014 2015 Sources: CDC, Get Treatment
Drug Poisoning Mortality in Spokane County (855) 638-9268 Estimated Age-adjusted Death Rate 27 25 23 per 100,000 people 21 19 17 15 13 11 9 7 1999 2000 2001 2002 2003 2004 2005 2006 2007 2008 2009 2010 2011 2012 2013 2014 2015 Sources: CDC, Get Treatment
Drug-related Deaths in Spokane County 2016 (855) 638-9268 Cocaine 33% Heroin 33% Meth 64% Sources: Medical Examiner, Get Treatment
Drug Poisoning Mortality in Pierce County (855) 638-9268 Age-adjusted Death Rate / 100,000 people 22 20 18 16 14 12 10 8 6 1998 2000 2002 2004 2006 2008 2010 2012 2014 2016 Sources: CDC, Get Treatment
Drug Poisoning Mortality in Clark County Age-adjusted Death Rate / 100,000 people (855) 638-9268 20 18 16 14 12 10 8 6 1998 2000 2002 2004 2006 2008 2010 2012 2014 Sources: CDC, Get Treatment
Drug-Related Hospitalizations Clark County and Washington State Age-adjusted Rate per 100,000 people (855) 638-9268 500 400 300 Washington State 200 Clark County 100 1998 2000 2002 2004 2006 2008 2010 2012 Sources: CDC, Get Treatment
Top Causes of Drug-related Deaths Yakima County 2016 Alcohol 17% Opiates 44% Meth 39% (855) 638-9268 Sources: Medical Examiner, Get Treatment
Yakima County Substance Abuse Mortality (855) 638-9268 Age-adjusted Death Rate / 100,000 people 14 12 10 8 6 4 1999 2000 2001 2002 2003 2004 2005 2006 2007 2008 2009 2010 2011 2012 2013 2014 2015 Sources: CDC, Get Treatment
Whatcom County Substance Abuse Mortality Age Adjusted Death Rate / 100,000 People (855) 638-9268 18 16 14 12 10 8 6 1999 2000 2001 2002 2003 2004 2005 2006 2007 2008 2009 2010 2011 2012 2013 2014 2015 Sources: CDC, Get Treatment
Whatcom County Substance Abuse Mortality Others 5% Meth 38% Heroin 57% (855) 638-9268 Sources: Medical Examiner, Get Treatment
King County Substance Abuse Mortality Age Adjusted Death Rate / 100,000 People (855) 638-9268 20 18 16 14 12 10 8 6 1999 2000 2001 2002 2003 2004 2005 2006 2007 2008 2009 2010 2011 2012 2013 2014 2015 Sources: CDC, Get Treatment Bellevue, Get Treatment Seattle
Top Causes of Drug-related Deaths King County, 2015 Oxycodone 6% Methadone 9% Opiates 32% Cocaine 12% Meth 18% Alcohol 23% (855) 638-9268 Sources: Medical Examiner, Get Treatment Bellevue, Get Treatment Seattle
Franklin County Substance Abuse Mortality Age Adjusted Death Rate / 100,000 People 12 11 10 9 8 7 6 5 4 1999 2001 2003 2005 2007 2009 2011 2013 2015 855-638-9268 Sources: CDC, Get Treatment