Download
1 / 56
560 likes | 977 Vues
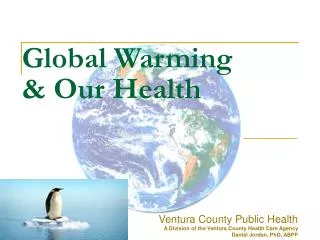
Global Warming & Our Health Ventura County Public Health A Division of the Ventura County Health Care Agency Daniel Jordan, PhD, ABPP History: Development of the Throw-Away Culture 1950s: History: Anti-Litter & Anti-Pollution Campaigns Begin

E N D
Global Warming & Our Health Ventura County Public Health A Division of the Ventura County Health Care Agency Daniel Jordan, PhD, ABPP
History: Anti-Litter & Anti-Pollution Campaigns Begin • 1960s: Espera De Corti Iron Eyes Cody
History: Earth Day, Birth of “Environmental Movement” • 1970s
Current Events: We have Impacted the Planet • Its about more than litter and pollution • It has become an issue of fundamentally altering the climate on the entire planet • Global warming will raise the overall average temperature, but that will change patterns so that some areas get wetter, some drier, and some actually get colder, such as Northern Europe if the Atlantic Gulf Stream is again disrupted
UN International Panel on Climate Change (IPCC): Trends in Conclusions 1990 Uncertainties and some evidence. 1995 “Evidence suggests a discernible human influence on global climate.” 2001 “Most warming of the past 50 years is likely (>66%) attributable to human activities.” 2007 “Warming is unequivocal, most warming in the past 50 years is very likely (90%) due to increases in greenhouse gases.”The Physical Basis of Climate Change
Global Climate Change is Speeding Up • Since the IPCC began, scientists have recorded “much stronger trends in climate change,” like a recent melting of polar ice that had not been predicted. • “If there’s no action before 2012, that’s too late. What we do in the next two to three years will determine our future. This is the defining moment.” • IPCC Chair Rajendra Pachauri — scientist and economist
Actual Changes Show “Human Forcings” (Impacts) Exceed “Natural Forcings” Computer models compare changes expected through natural impacts (solar and volcanoes) alone with those that include human impacts, and both with actual observed changes. Actual observations best match the models that include human impact. Models using both “natural” and anthropogenic (human) forcings Models using only “natural” forcings Observations Figure SPM. 4 ©IPCC
Global Impacts: Example, Tienamen Square, Beijing, China A man flying a kite in Tiananmen Square last Boxing Day. Pollution levels on a typical day in Beijing are five times above World Health Organisation standards for safety, and are worse in the summer, worrying Olympic athletes. Three million cars and coal-fired factories, steel mills and skyscraper builds throughout the city have caused the smog. To ‘clean’ the air for the Olympics, Chinese authorities will take 1m cars off the road and are closing factories a month in advance. Photograph: Oded Balilty/AP
Global Impacts: Cape Hatteras, 1999 to 2004 • Front houses abandoned, created a berm • http://www.worldviewofglobalwarming.org/pages/rising-seas.html
Sea Ice 2007 2007 exposed one million square miles of open water -- six Californias -- more than the average since satellites started measurements in 1979.
This Just In: In 2007 the IPCC predicted 2042 as a 35% reduction, not 2007: Complete arctic melt would not occur until after 2100 2007 What Actually Happened, 35% Melt by 2007: Complete Arctic Melt now Predicted by 2013, or even 2008)
And This Just In: • 160 square miles of Antarctica’s Wilkins ice shelf has been lost since the end of February, 2008 leaving the ice interior now ‘hanging by a thread’. “We predicted it would happen, but it's happened twice as fast as we predicted.” • Professor David Vaughan of the British Antarctic Survey (BAS). • The land-based ice that was held back by the sea-ice is now open to slipping into the ocean and melting.
Local Impacts:Sea Level Rise SEA LEVEL RISE IN CALIFORNIA: Sea level rise provides a physical measure of possible oceanic response to climate change. This indicator shows the rising trend in sea level measured at two California stations: San Francisco and La Jolla. Long-term data from 10 of 11 California stations show increases in sea level at varying rates. The rise in global sea level is attributed to the melting of mountain glaciers and ice sheets around the globe and the thermal expansion of ocean water. Sea level rise is not a new phenomenon, having been a major natural component of coastal change throughout time. Differences in sea level rise along the coast can occur because of local geological forces, such as land subsidence and plate tectonic activity. However, there is concern that the rate of sea level rise may increase with possibly increased global warming. http://co-ops.nos.noaa.gov
Local Impacts:Sea Level Rise SEA LEVEL RISE IN CALIFORNIA: Sea level rise provides a physical measure of possible oceanic response to climate change. This indicator shows the rising trend in sea level measured at two California stations: San Francisco and La Jolla. Long-term data from 10 of 11 California stations show increases in sea level at varying rates. The rise in global sea level is attributed to the melting of mountain glaciers and ice sheets around the globe and the thermal expansion of ocean water. Sea level rise is not a new phenomenon, having been a major natural component of coastal change throughout time. Differences in sea level rise along the coast can occur because of local geological forces, such as land subsidence and plate tectonic activity. However, there is concern that the rate of sea level rise may increase with possibly increased global warming. http://co-ops.nos.noaa.gov
Local Impacts: Invasive Species • Coastal communities climate change • Humboldt squid (which can grow up to 7’ long) have spread up the California coast as ocean waters warm up. They eat local fish. • "It's the latest in a long series of bad news for fishermen," said Lou Zeidberg, Stanford University.
Layers of Change • Climate change is a “macro” result of human behavior on our planet and ourselves. • Air pollution, water pollution, increases in wastes, including toxic wastes harm our health directly, and change the environment too. • The science simply confronts the fact that effects we think of as small and local also create macr global changes. • Smog not only harms our lungs directly, it impacts the planet too.
Centers for Disease Control: Impacts of Climate Change on Health
Climate-Sensitive Diseases • Human induced climate change "is likely to have wide-ranging and mostly adverse impacts on human health, with significant loss of life." • 2007 IPCC Report • Harvard Medical School researchers have linked recent U.S. outbreaks of dengue ("breakbone") fever, malaria, hantavirus and other diseases to climate change.
Climate-Sensitive Diseases • Increased sea level and sea surface temperatures can lead to higher incidence of water-borne infectious and toxin-related illnesses such as cholera and shellfish poisoning; • Zooplankton proliferate in warmer water temperatures; are a cholera carrier. Cholera killed 120,000 world-wide people in 1995, mostly children. • Encephalitis, another illness with strong links to warmer temperatures, is on the rise. Since 1987 California, Arizona, Texas, Florida, Mississippi, New Orleans, and Colorado have had major outbreaks.
Vector Borne Malaria Dengue Fever Lyme Disease Hantavirus Tularemia Plague Encephalitis Ehrlichiosis Ross River Fever Water and Food-Borne Cholera Leptospirosis Giardiasis Human Enteric Viruses Campylobac-teriosis Salmonela Climate-Sensitive Diseases • Airborne (and other) • Meningitis • Respiratory viruses • Coccidiodomy-cosis • Legionnaire’s Disease • Influenza
Old Diseases in New Places • Paul Epstein, MD, worked in Africa, now at Harvard Medical School, said scientists haven’t been worried enough. "Insects are exquisitely sensitive to temperature changes.” • "Things we projected to occur in 2080 are happening in 2006. What we didn't get is how fast and how big it is, and the degree to which the biological systems would respond. Our mistake was in underestimation.” • www.washingtonpost.com/wp-dyn/content/article/2006/05/04/AR2006050401931.html
Old Diseases in New Places • Disease-carrying mosquitoes can now survive in new places. Mosquitoes that carry dengue fever viruses were limited to elevations below 3,300 feet but now appear at 7,200 feet in the Andes of South America. • Dengue Fever has re-emerged in the Caribbean. • Malaria has been detected in new higher-elevation areas in Indonesia. • Diseases like West Nile Virusnow spread farther when they get the chance (e.g., via airlines)
Spread of Tropical Diseases: West Nile Virus Example 1999 to 2007: West Nile Virus is spread by mosquitoes that were able to invade the U.S. and even into Canada as small changes in weather made it easier for them to survive in these new locations. Source of Maps: http://www.cdc.gov/ncidod/dvbid/westnile/surv&control.htm (Click on “Human Incidence Maps”) “California Cases & Deaths” refers to the total number of West Nile Virus cases and deaths in California.
1999 California Cases & Deaths = 0 & 0 West Nile virus maps reflect surveillance reports released by state and local health departments to CDC's ArboNET system for public distribution. Map shows the distribution of human neuroinvasive disease (encephalitis and/or meningitis) incidence occurring during 2006 with number of human cases shaded according to incidences ranging from .01 to 9.99, 10 to 99.99, greater then 100 per million population, and WNV activity (human, mosquito, veterinary, avian and sentinel data). USGS: http://www.cdc.gov/ncidod/dvbid/westnile/Mapsincidence/surv&control99IncidMaps.htm
2000 California Cases & Deaths = 0 &0 West Nile virus maps reflect surveillance reports released by state and local health departments to CDC's ArboNET system for public distribution. Map shows the distribution of human neuroinvasive disease (encephalitis and/or meningitis) incidence occurring during 2006 with number of human cases shaded according to incidences ranging from .01 to 9.99, 10 to 99.99, greater then 100 per million population, and WNV activity (human, mosquito, veterinary, avian and sentinel data). USGS: http://www.cdc.gov/ncidod/dvbid/westnile/Mapsincidence/surv&control00IncidMaps.htm
2001 California Cases & Deaths = 0 & 0 West Nile virus maps reflect surveillance reports released by state and local health departments to CDC's ArboNET system for public distribution. Map shows the distribution of human neuroinvasive disease (encephalitis and/or meningitis) incidence occurring during 2006 with number of human cases shaded according to incidences ranging from .01 to 9.99, 10 to 99.99, greater then 100 per million population, and WNV activity (human, mosquito, veterinary, avian and sentinel data). USGS: http://www.cdc.gov/ncidod/dvbid/westnile/Mapsincidence/surv&control01IncidMaps.htm
2002 California Cases & Deaths = 1 & 0 West Nile virus maps reflect surveillance reports released by state and local health departments to CDC's ArboNET system for public distribution. Map shows the distribution of human neuroinvasive disease (encephalitis and/or meningitis) incidence occurring during 2006 with number of human cases shaded according to incidences ranging from .01 to 9.99, 10 to 99.99, greater then 100 per million population, and WNV activity (human, mosquito, veterinary, avian and sentinel data). USGS: http://www.cdc.gov/ncidod/dvbid/westnile/Mapsincidence/surv&control02IncidMaps.htm
2003 California Cases & Deaths = 3 & 0 West Nile virus maps reflect surveillance reports released by state and local health departments to CDC's ArboNET system for public distribution. Map shows the distribution of human neuroinvasive disease (encephalitis and/or meningitis) incidence occurring during 2006 with number of human cases shaded according to incidences ranging from .01 to 9.99, 10 to 99.99, greater then 100 per million population, and WNV activity (human, mosquito, veterinary, avian and sentinel data). USGS: http://www.cdc.gov/ncidod/dvbid/westnile/Mapsincidence/surv&control03IncidMaps.htm
2004 California Cases & Deaths 289 & 28 West Nile virus maps reflect surveillance reports released by state and local health departments to CDC's ArboNET system for public distribution. Map shows the distribution of human neuroinvasive disease (encephalitis and/or meningitis) incidence occurring during 2006 with number of human cases shaded according to incidences ranging from .01 to 9.99, 10 to 99.99, greater then 100 per million population, and WNV activity (human, mosquito, veterinary, avian and sentinel data). USGS: http://www.cdc.gov/ncidod/dvbid/westnile/Mapsincidence/surv&control04IncidMaps.htm
2005 California Cases & Deaths 299 & 19 West Nile virus maps reflect surveillance reports released by state and local health departments to CDC's ArboNET system for public distribution. Map shows the distribution of human neuroinvasive disease (encephalitis and/or meningitis) incidence occurring during 2006 with number of human cases shaded according to incidences ranging from .01 to 9.99, 10 to 99.99, greater then 100 per million population, and WNV activity (human, mosquito, veterinary, avian and sentinel data). USGS: http://www.cdc.gov/ncidod/dvbid/westnile/Mapsincidence/surv&control05IncidMaps.htm
2006 California Cases & Deaths = 278 & 7 West Nile virus maps reflect surveillance reports released by state and local health departments to CDC's ArboNET system for public distribution. Map shows the distribution of human neuroinvasive disease (encephalitis and/or meningitis) incidence occurring during 2006 with number of human cases shaded according to incidences ranging from .01 to 9.99, 10 to 99.99, greater then 100 per million population, and WNV activity (human, mosquito, veterinary, avian and sentinel data). USGS: http://www.cdc.gov/ncidod/dvbid/westnile/Mapsincidence/surv&control06IncidMaps.htm
2007 California Cases & Deaths = 381 & 18 West Nile virus maps reflect surveillance reports released by state and local health departments to CDC's ArboNET system for public distribution. Map shows the distribution of human neuroinvasive disease (encephalitis and/or meningitis) incidence occurring during 2007 with number of human cases shaded according to incidences ranging from .01 to 9.99, 10 to 99.99, greater then 100 per million population, and WNV activity (human, mosquito, veterinary, avian and sentinel data). USGS: http://www.cdc.gov/ncidod/dvbid/westnile/Mapsincidence/surv&control07IncidMaps.htm
Linkages: Global Climate Change and Chronic Diseases • Expansion of temperate climates leads to spread of viruses that lead to auto-immune diseases. • Air pollution directly causes respiratory and other ailments and also leads to global warming. Respiratory problems lead to reduced physical activity that leads to obesity, diabetes, and other chronic diseases. All of these things are linked.
Linkages: Global Climae Change and Chronic Diseases • We typically think of environmental links through air pollution. It is more • Ozone • Nitrogen Dioxide • Acid Vapor • Particulate Matter That is Breathed Deep into the Lungs (PM10, PM2.5) • All directly impact respiratory and cardiovascular health and climate change
Global Climate Change and Chronic Diseases • Redesigning cities as “human habitats” will help solve the dual crises posed by the obesity epidemic and global warming. • “We need to build the physical activity back into our lives and its not simply about bike paths, it’s about developing an urban habitat that enables people to live healthy lives: ensuring that people can meet most of their daily needs within walking and cycling distance of where they live.” • Prof. Tony Capon, Project Director for the Oxford Health Alliance's Environmental Design for Prevention Initiative
Global Climate Change and Chronic Diseases • 2003-2004 pediatric asthma cases increased from 11,848 to 18,138 (53%) • American Lung Association data
Public Health’s Role Centers for Disease Controlhttp://www.cdc.gov/nceh/climatechange/
Centers for Disease Control: Public Health’s Role in Climate Change • Serve as a credible source of information on the health consequences of climate change for the U.S. population [locally] and globally. • Track data on environmental conditions, disease risks, and disease occurrence related to climate change. • Expand capacity for modeling and forecasting health effects that may be climate-related. • Enhance the science base to better understand the relationship between climate change and health outcomes.
Centers for Disease Control: Public Health’s Role in Climate Change • Identify locations and population groups at greatest risk for specific health threats, such as heat waves. • Communicate the health-related aspects of climate change, including risks and ways to reduce them, to the public, decision makers, and healthcare providers. • Develop and implement preparedness and response plans for health threats such as heat waves, severe weather events, and infectious diseases. • Develop partnerships with other government agencies, the private sector, nongovernmental organizations, universities, and international organizations to more effectively address U.S. and global health aspects of climate change.
Centers for Disease Control: Public Health’s Role in Climate Change • Provide leadership to . . . community leaders, healthcare professionals, nongovernmental organizations, the faith-based communities, the private sector and the public, domestically and internationally, regarding health protection from climate change effects. • Provide technical advice and support to [agencies], the private sector, and others in implementing . . . preparedness measures related to the health effects of climate change. • Promote workforce development by helping to ensure training of a new generation of competent, experienced public health staff to respond to health threats posed by climate change.
Rethinking Change Rethink and Reset Values and Behavior: Think Locally, Act Globally Reduce the Flow: Adjust Things Buy Some Things Stop Buying Other Things . . . and save money while we do all this!
Rethink & Reset Values & Behavior • Is “cheapest” always the least expensive? • Is expensive always the best? • Do we really need it at all? • Let’s talk about the balance sheet. Examples: • Plastic cups & dishes vs washing them. • Community meetings: Must it be highly packaged lunches? Ever see our trash at the end of a day-long meeting? • 800,000 plastic bottles used in the US each DAY • Change values on purchases
Reduce the Flow • Set and measure environmental goals. • Require vendors to meet sustainability standards (and meet them ourselves) • Turn off lights, turn on only one switch, not two • Turn off computers, printers, machines that “sleep” (at 30% of “on” energy use) Save over 1,000 lbs of CO2 and $256 per year. • Stop using plastic and paper cups, plates, etc. • Report leaking faucets at work and fix them at home. Turn off faucets.
Reprogram Ourselves and Our Kids • Yes, [child’s name], this is another teaching moment! • Learn about global warming, and how it relates to global justice. • Learn, Teach, Do! (Ignore when our kids whine “but mom, but dad!”) • Think outside the box, get creative. • (Turn off the TV!)
Just Stop Buying “Stuff!” • We have been programmed to believe we always need the newest, best, hottest, in season things. (They get our money, we get their stuff.) • We don’t need this much stuff! • Experiment: Take a week or month and just stop buying stuff. Instead of “shopping” or watching TV, go for a walk or hike, read a book. • Save thousands each year, reduce massive amounts of energy and waste. Save the planet!