1 / 6

DATA ANALYTIC pdf.

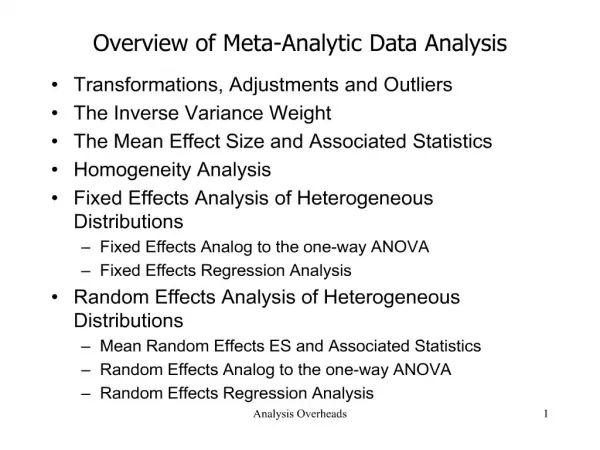
Data analytics is the process of examining raw data to draw meaningful conclusions. It involves collecting, transforming, and organizing data to identify patterns, trends, and relationships, ultimately leading to informed decision-making. In essence, it's about extracting valuable insights from data to solve problems, improve processes, and predict future outcomes

Food48
Télécharger la présentation

DATA ANALYTIC pdf.

An Image/Link below is provided (as is) to download presentation Download Policy: Content on the Website is provided to you AS IS for your information and personal use and may not be sold / licensed / shared on other websites without getting consent from its author. Content is provided to you AS IS for your information and personal use only. Download presentation by click this link. While downloading, if for some reason you are not able to download a presentation, the publisher may have deleted the file from their server. During download, if you can't get a presentation, the file might be deleted by the publisher.

E N D

Presentation Transcript


  1. DATA ANALYTIC Data Analytics is the process of systematically examining data to discover useful information, patterns, trends, and relationships. It involves collecting, organizing, cleaning, and analyzing data using statistical methods, programming tools, and visualization techniques. The goal is to extract meaningful insights that support effective decision-making and strategic planning.In today's digital world, massive volumes of data are generated every second from sources like social media, websites, business transactions, sensors, and more. Data analytics helps organizations make sense of this raw data, turning it into valuable information. It plays a vital role in fields such as business, healthcare, finance, education, and government by enabling evidence-based decisions, improving efficiency, and predicting future trends. It is a multidisciplinary field that blends techniques from statistics, computer science, machine learning, and domain expertise to interpret data effectively.In an age where massive volumes of data are generated every second—through digital transactions, social media activity, mobile applications, sensors, and online platforms—data analytics becomes essential for making sense of this vast information. Types of data analytics :- 1. Descriptive Analytics Purpose: To understand what has already happened. Function: Summarizes raw data into readable formats like charts, reports, and dashboards. Tools: Excel, Power BI, Tableau. Examples: oMonthly sales reports. https://whitehatcoders.com/

  2. 2. Diagnostic Analytics Purpose: To determine why something happened. Function: Explores data more deeply to find causes or correlations. Techniques: Drill-down analysis, data mining, correlation analysis. Examples: oAnalyzing why customer churn increased. oInvestigating the drop in product sales in a specific region. 3. Predictive Analytics Purpose: To forecast what is likely to happen in the future. Function: Uses statistical models, historical data, and machine learning. Tools: Python (scikit-learn), R, SAS, IBM SPSS. Examples: oPredicting future sales based on past trends. oIdentifying customers likely to cancel a subscription. 4. Prescriptive Analytics Purpose: To suggest the best course of action. Function: Recommends decisions using algorithms and simulations. Techniques: Optimization, decision trees, scenario analysis. Examples: oSuggesting inventory restocking strategies. oRecommending pricing models for maximizing profit. 5. Cognitive Analytics (AI-driven Analytics) Purpose: To simulate human thinking for deeper decision-making. Function: Uses artificial intelligence, natural language processing (NLP), and machine learning to interpret data. Examples: oChatbots that understand customer queries. oAI tools that learn and adapt to business environments in real time. https://whitehatcoders.com/

  3. Scope of data analytic:- 1. Business Decision-Making Informed strategic planning through real-time data insights. Improved efficiency, reduced costs, and optimized operations. Examples: Sales forecasting, customer segmentation, inventory control. 2. Industry-Wide Applications Data analytics is used across almost every industry: Industry Healthcare Finance Retail Education Manufacturing Predictive maintenance, quality control. Government Policy evaluation, public health monitoring, traffic control. Use Cases Disease prediction, patient data analysis, treatment plans. Fraud detection, credit scoring, risk assessment. Purchase behavior, dynamic pricing, personalized marketing. Student performance tracking, dropout prediction. 3. Types of Analytics in Action Descriptive Analytics→ Reporting past performance. Predictive Analytics→ Forecasting future trends. Prescriptive Analytics→ Recommending decisions. Diagnostic Analytics→ Identifying reasons for outcomes. 4. Career Opportunities Demand for data professionals is high, with a wide range of roles: https://whitehatcoders.com/

  4. Data Scientist Data Engineer BI Developer Machine Learning Engineer Companies across sectors — from startups to tech giants — are hiring skilled data professionals, especially those proficient in tools like Python, SQL, R, Power BI, Tableau, and Excel. 5. Integration with Emerging Technologies Data analytics works hand-in-hand with: Artificial Intelligence (AI) & Machine Learning Big Data Technologies (Hadoop, Spark) Cloud Computing (AWS, Azure, GCP) Internet of Things (IoT) These integrations make analytics more scalable, automated, and intelligent. https://whitehatcoders.com/

  5. Benefit of data analytic:- 1. Better Decision-Making Helps organizations make data-driven, informed decisions. Reduces guesswork and reliance on intuition. Example: A retail store uses sales data to decide which products to stock more. 2. Cost Reduction Identifies inefficient processes and helps reduce waste or unnecessary spending. Example: An airline uses analytics to optimize fuel usage and reduce operational costs. 3. Improved Operational Efficiency Streamlines business processes and identifies bottlenecks. Example: Manufacturing firms use data to monitor equipment and schedule maintenance before failures occur. 4. Enhanced Customer Experience Analyzes customer behavior to offer personalized recommendations or services. Example: E-commerce platforms use data analytics to suggest products based on past purchases. 5. Risk Management Example: Banks use predictive analytics to identify suspicious transactions in real-time. https://whitehatcoders.com/

  6. Salary package of data analytic in India (INR) Data Analyst Salary Package in India (INR) Experience Level Salary Range (Annual Package)Typical Roles/Notes Entry-Level (0-2 yrs)₹3,00,000 –₹6,00,000 Junior Data Analyst, fresher roles Mid-Level (2-5 yrs)₹6,00,000 –₹12,00,000 Data Analyst, BI Analyst Senior-Level (5+ yrs)₹12,00,000 –₹20,00,000+ Senior Data Analyst, Analytics Manager https://whitehatcoders.com/

More Related