Population Growth and Population Projections
Population Growth and Population Projections. Birth Intervals. Post partum ovulation time to conceive birth Amenorrhea conception. Menarche. Marriage. 1 st Birth. 2 nd Birth. 3 rd Birth. Issues Events out of order (births then marry) IVF


Population Growth and Population Projections
E N D
Presentation Transcript
Birth Intervals Post partum ovulation time to conceive birth Amenorrhea conception Menarche Marriage 1st Birth 2nd Birth 3rd Birth • Issues • Events out of order (births then marry) • IVF • Right censoring • Multiple births Menopause
Population Growth • P(t+1) = P(t) + B(t) – D(t) + I(t) – E(t) • For now ignore migration • Focus on births and deaths together
Fertility and Population Growth • TFR • number of children born into a population • 2.1 is considered replacement level fertility • Sex ratio of births • Number of females in the population • Gross reproduction rate (GRR) • Same as TFR except counts only female births • Usually male births outnumber female births • TFR = GRR x 2.05 (approx)
Fertility and Population Growth • Mortality • To sustain a population, need to know how many females survive to reproductive age • Evolutionary biologists often refer to this is reproductive fitness (measured as • Net reproduction rate (NRR) • Number of daughters born to a women that controls for mortality
Net Reproduction Rate Total number of daughters born between 15 and 49 that takes into account survival of mothers. Lx refers to number of person years lived by a cohort of women fx refers to the age – specific fertility rate
NRR • NRR < GRR because of mortality • If NRR = GRR, then women are immortal while in their reproductive years • If fertility and mortality rates are constant for many years, have a constant growth rate.
Using the NRR to Predict Growth • NRR is a cohort measure of growth since it assumes a number of daughters over the reproductive years • Most calculate NRR for a single year • Japan in 1968 – • TFR = 1.6 • GRR = 0.8 • NRR < 0.8 • Would predict population decline; didn’t happen
Geometric and Exponential Growth Geometric Growth Assumes additions/deletions happen once a year
Growth Rates Population Growth Rates in Urban and Rural Areas, Less and More Developed Countries, 1975 to 2000 and 2000 to 2025. Derived from United Nations, World Urbanization Prospects: The 1999 Revision (2000).
Geometric and Exponential Growth Exponential Growth Assumes additions/deletions happen throughout the year
In some urban areas in developing countries, growth rate is .07 or 7% so 70/7 means a population doubling in 10 years Many developed countries have very low growth rates and, as a result, the equation shows doubling times of hundreds or thousands of years. But these countries are not expected to ever double again. Most, in fact, likely have population declines in their future. Many less developed countries have high growth rates that are associated with short doubling times, but are expected to grow more slowly as birth rates are expected to continue to decline
R=6.9% R=4.2% R=3.5%
Annual Growth Rate and NRR • Link NRR to growth rate • NRR is a comparison of one generation (mothers) to another (daughters) • Measure the population size after the length of one generation (g) • Note: book does not mention gender per se
Population Structure • Population pyramids • Age/sex histograms • http://www.census.gov/ipc/www/idbpyr.html
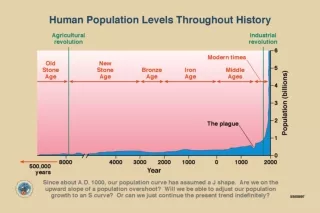
HIGHLIGHTS IN WORLD POPULATION GROWTH 1 billion in 1804 2 billion in 1927 (123 years later) 3 billion in 1960 (33 years later) 4 billion in 1974 (14 years later) 5 billion in 1987 (13 years later) 6 billion in 1999 (12 years later)
Dependency Ratio • Another measure of the age distribution • Defined as the number of non-working age persons per 100 working age persons
Stable Population • Lotka's concept of a stable population (circa 1907). • If any population has: • No migration, • Mortality & fertility age-specific rates remain constant for a long period • Then a fixed age structure will develop (called stable age structure) which does not depend of the initial age structure. • Population will also increase in size at a constant rate. • Stationary population (which has a zero rate of increase) is a special case of stable population
Stationary Population • A population with • No migration • Constant age specific mortality • Has birth and death rates that yield a growth rate of ZERO • This is known as a stationary population. • Its size is constant and its age structure (% in each age category) is also constant.
How Many Are There in A Stable Population? Objective: Calculate Ax
How Many Are There in A Stable Population? Objective: Calculate b, crude birth rate, in a stable population
How Many Are There in A Stable Population? Objective: Calculate population x+1/2 years ago The number of births in a stable population that occurred x + 1/2 years ago is simply the crude birth rate b (which does not change) times the population x + 1/2 years ago. Now, not all those people survived – need to calculate proportion survived to age x:
How Many Are There in A Stable Population? (Number born x+1/2 years ago) x (survived at age x+1/2) tells you how many people there will be at age x today in a stable population
Population Projections • Why Do It? • How To Do It? • Mathematical models • Simple • Works for some circumstances • Component Method • Harder • More extensive data requirements
Mathematical Models Implies perpetual growth or ultimate extinction Assumes there are upper and lower bounds to population size
Exponential Growth GO TO EXCEL
Logistic Growth Last line is specified as a regression and can be estimated as one GO TO EXCEL
Component Method • Needs a great deal of data, often at the level of detail of single ages. • The number of components can vary depending upon the type of projection needed • All projections reflect the assumptions you make about which components you use, their stability/change over time, and how far into the future you project
Component Method Equations 1 and 2 show m(ale) superscripts; comparable equations for females
Europe has just entered a critical phase of its demographic evolution. Around the year 2000, the population began to generate "negative momentum": a tendency to decline owing to shrinking cohorts of young people that was brought on by low fertility (birthrate) over the past three decades. Currently, the effect of negative momentum on future population is small. However, each additional decade that fertility remains at its present low level will imply a further decline in the European Union (EU) of 25 to 40 million people, in the absence of offsetting effects from immigration or rising life expectancy.
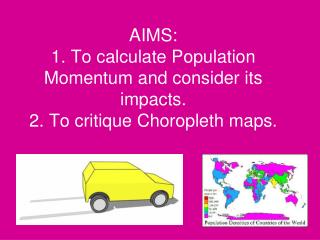
Population Momentum The tendency for population growth to continue beyond the time that replacement-level fertility has been achieved because of a relatively high concentration of people in the childbearing years. For example, the absolute numbers of people in developing countries will continue to increase over the next several decades even as the rates of population growth will decline. This phenomenon is due to past high fertility rates which results in a large number of young people. As these youth grow older and move through reproductive ages, the greater number of births will exceed the number of deaths in the older populations
Projection methods and assumptions. The alternative population projections were carried out using standard cohort component population projection methods using software developed by the authors. Since this analysis aims at isolating the impacts of alternative fertility assumptions, in all scenarios only the fertility component was modified as described in Table 1, while we assumed that mortality stayed constant at life expectancies of 81.5 years for women and 75.5 years for men. We also assumed a closed population without migration.