Population Growth
Population Growth. 2 Why be concerned about population growth?. Hydrilla. Overpopulation and Population Depletion. 3 Population – all organisms of the same species (type) in a defined area - definition must include species, location, and time


Population Growth
E N D
Presentation Transcript
2 Why be concerned about population growth? Hydrilla Overpopulation and Population Depletion
3 Population – all organisms of the same species (type) in a defined area - definition must include species, location, and time examples: - all the catfish in Lake Carlyle in January of 2000 - All the human beings in the United States in November of 2003
4 What do researchers study in regards to population? - geographic range (area inhabited by a population) - density (# of individuals per unit area) - distribution (how they are spaced out) - growth rate (whether they increase, decrease, or stay the same) - age structure (# of males & females of each age)
5 geographic range • the area inhabited by a population • can be a few cubic centimeters like the bacteria in a rotting apple • or millions of square kilometers like migrating whales in the Pacific Ocean
7 population density • number of individuals per unit area • can vary tremendously • population of saguaro cactus in the desert plant community, for example, has a low density
8 POPULATION DISTRIBUTION – how individuals are spaced out within their community depends on abiotic (nonliving) factors like water, space, nutrients
9 Population Distribution Uniform Random Clumped
10 1. clumped – patches of organisms (clusters) due to patchy resources examples: trees in a desert at an oasis 2. uniform – evenly spread out organisms due to intraspecific competition (fighting over resources) examples: desert shrubs, arctic penguins nesting 3. random – neither uniform or clumped (a little of each), very uncommon because there is usually competition and limited resources
11 What natural factors affect population growth? • Birth rate (natality) • Death rate (mortality) • Rate that individuals enter or leave the population (immigration and emmigration) By how many individuals are added to it or are removed!
12 Birth and Death Rate • What happens to a population if the birthrate is greater than the death rate? • What happens to a population if the birthrate is less than the death rate? • What happens to a population if the birthrate equals the death rate?
13 Immigration and Emigration • Immigration: individuals move into a population’s range • Emigration: individuals move out of the population’s range to another Which one causes a population to increase and which one to decrease? What could cause these to happen?
14 POPULATION DISPERSAL - how organisms spread out to new locations - easier for humans in developed areas – cars, trains, planes… - simpler organisms depend on wind, water, other organisms example: dandelions – wind, weeds – burrs
15 population growth – birthrate and immigration exceed death rate and emigration GROWTH RATE- the net increase or decrease in a population size over time biotic potential – maximum population growth due to unlimited resources (rarely occurs due to limiting factors)
16 Exponential Growth • The size of each generation of offspring will be larger than the generation before it • Occurs under ideal conditions with unlimited resources • All the food and space a population needs • Protect the population from predators & disease • Remove a populations waste products • Often occurs when an organism is moved to another, new environment. • The larger a population gets, the faster it grows.
18 Exponential growth occurs when the individuals in a population reproduce at a constant rate. • Under ideal conditions with unlimited resources, a population will grow exponentially. • If bacteria have a doubling time of 20 minutes, within 20 minutes the first bacterium will divide to produce 2 bacteria. Twenty minutes later, the 2 bacteria will divide to produce 4. After another 20 minutes, there will be 8 bacteria. In another hour, there will be 64 bacteria; and in just one more hour, there will be 512. In just one day, this colony will grow to an astounding size of 4,720,000,000,000,000,000,000.
19 EXPONENTIAL GROWTH – J – curve BABY BOOM - doubling and redoubling growth *Almost any organism will experience a rapid increase in population if it has ideal conditions such as unlimited food, water, and space. THE LARGER A POPULATION GETS, THE FASTER IT GROWS! – more organisms to reproduce
20 Can a population grow exponentially forever? Logistic growth: occurs when a population’s growth slows and then stops, following a period of exponential growth. How do birth rate, death rate, immigration and emigration help create logistic growth? When a population grows exponentially, eventually space and other abiotic factors will run out and have an affect on the growth rate.
22 lag phase(latent period) – initial period of slow growth (not accustomed to the environment) growth phase (exponential) – increasing population size stationary phase (steady state) – population size levels off, rises and falls slightly, but remains relatively the same death phase – final phase, doesn’t always happen, population size declines - happens when population size exceeds the carrying capacity and depletes resources population decline – death rate and emigration exceed birth rate and immigration ZPG – zero population growth (births = deaths)
23 • CARRYING CAPACITY – the maximum number of an organism that a given ecosystem can support • - if population goes above this, some will die • horizontal line through steady state • DYNAMIC EQUILIBRIUM – when population fluctuates around the carrying capacity at the stationary phase
24 So what helps determine the carrying capacity? Limiting factor: environmental factors that establish a carrying capacity and slow population growth Acting separately or together, limiting factors determine the carrying capacity of an environment for a species. What are some examples of limiting factors for an animal? For a plant?
Two types of limiting factors: density-dependent density-independent
26 density-dependent limiting factors – affected by crowding (density) - operate more strongly on large populations than on small populations more individuals in a given space – more dense
27 examples: 1. disease, parasitism 2. crowding and stress 3. competition for resources like food, water, and space – particularly intraspecific • predator-prey interactions – coexist • one of the best-known mechanisms of population control
28 intraspecific competition – competition within the same species interspecific competition – competition among different species – driving force of evolution
Wolf and Moose Population The relationship between moose and wolves on Isle Royale illustrates how predation can affect population growth. 29 The moose population was also affected by changes in food supply, and the wolf population was also affected by disease.
Wasp Cocoons This larval sphinx moth has been attacked by a parasitic wasp. The wasp inserted its eggs beneath the moth's skin. The larvae fed on their host internally until they appeared as white cocoons on its back 30 Parasitism and Disease Parasites can also limit the growth of a population by taking nourishment at the expense of their hosts, often weakening them and causing disease or death. **The denser the population, the easier disease spreads.
31 *Competition among similar species is the driving force of evolution by natural selection – survival of the fittest Gause’s principle of competitive exclusion – no two organisms can occupy the same niche *competitive exclusion principle *They will compete for resources, and only one will live. Niche – the role an organism plays in its environment.
32 density-independent limiting factors – not affected by crowding Ex.: 1. weather (hurricanes, droughts, floods, extreme temps, heavy snowfall) 2. natural disasters (wildfires, volcanoes) Human activities such as damming a river, deforestation, or plowing a field are density-independent factors.
33 Introduced Species In their natural environment, limiting factors (mostly density-dependent) would keep the population under control. When they are introduced somewhere else, those limiting factors may or may not be present. If they are not, what could happen? So what we do to combat these species when they take over? - create limiting factors, some natural and some artificial
34 "It's not because people started breeding like rabbits. It's that they stopped dying like flies."... Nicholas Eberstadt, a demographer at the American Enterprise Institute Human Population Growth hunter-gatherers agricultural revolution industrial revolution - fossil fuels coal, oil, natural gas
35 Why should we be worried about human population growth? FamINE HoMElessness OvERCrOWdINGPOLLUTion DIseaSEPandEMICS
36 Human Population Growth Curve What shape is the growth curve? What kind of growth is this? Can this kind of growth go on forever?
Initially, how did humans get the resources they needed to survive? Around 8,000 BC, what revolution happened that allowed the population to grow a little faster? In 1850 AD, what revolution happened that allowed the population to start growing exponentially?
38 Hunting and Gathering • gathered wild seeds, fruits, and nuts • nomadic • still • the first humans to arrive in North America about 12,000 years ago caused a major mass extinction of animals like woolly mammoths, and saber-toothed cats • cheetahs, zebras, and yaks disappeared from the continent
39 Agriculture • Agrarian: By the end of the last ice age—about 11,000 years ago—humans began the practice of farming. Three advantages: • dependable supply • produced in large quantity • stored for later use • Agricultural Revolution – 1750 to 1900, more food needed to be produced to keep up with the people • Green Revolution – 1943 to present, advances in tools, pesticides, herbicides, fertilizers
40 Industrial Growth and Urban Development • added machines and factories to civilization during the 1800s • energy for this from fossil fuels—coal, oil, and natural gas • discarded wastes into the air, water, and soil • The abundance of jobs and commerce caused the human growth curve to enter its exponential phase
42 What are some factors that have contributed to the success of the human population (decreased death rate)? • the recent history of the human population has been affected more by declines in death rates than by increases in birth rates • better nutrition • greater access to medical care • improved sanitation • more widespread immunization
43 Thomas Malthus – believed that three density-dependent limiting factors would limit human population growth. What were these three? Recommended population laws so that we would not run out of food and resources. War Famine Plague
44 Demography: scientific study of human populations Attempt to predict how a population will change over time. To help predict why some countries have a higher growth rate than others, demographers look at three things: 1. birth rate 2. death rate 3. age structure Also look at social and economic factors.
45 Demographic Transition Stage 1: Birth rate and death rate are equally high, so not really much growth overall (occurred this way for most of human history) Stage 2: birthrate remains high while death rate drops, causing the population to grow quickly (last 150 years) Stage 3: birth rate falls to meet the death rate, so overall growth slows and levels off (occurring now)
46 The Demographic Transition • Over the past century, population growth in the United States, Japan, and much of Europe has slowed dramatically(fewer births due to higher levels of education and the rise of living standards) • Throughout most of history, human societies have had high death rates and equally high birthrates. • With advances in nutrition, sanitation, and medicine, more children survive to adulthood and more adults live to old age. • These changes lower the death rate and begin the demographic transition. At first, birthrates remain high and exceed deaths, and population increases rapidly. Many parts of South America, Africa, and Asia are still in this phase.
47 AGE STRUCTURE DIAGRAMS reproductive base – number of individuals in reproductive or pre-reproductive years – will be able to have children
48 U.S. and Rwandan population age structures What can we predict for the growth of these two populations based upon their age structure diagrams?
49 World Population Growth Based on the projected trend between 2040 and 2050, what might the world population be in 2060?
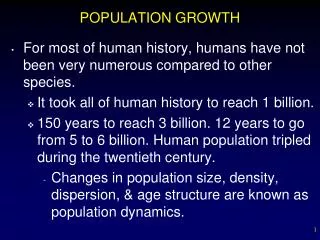
50 WHAT’S THE CURRENT SITUATION? Over 7,000,000,000 people. Took only twelve years to increase from 6 billion. In 1900, we had 1.6 billion people. In 99 years, we flipped that to 6.1 billion. By 2050, we are expected to be at 9.2/10.5 billion World population will nearly stabilize at just above 10 billion persons after 2200 For US Population Growth: COMPONENT SETTINGS FOR NOVEMBER 2011 One birth every.................................. 8 seconds One death every.................................. 12 seconds One international migrant (net) every............ 43 seconds Net gain of one person every..................... 16 seconds http://www.worldometers.info/