Presenting Work: Graphics and Charts
90 likes | 376 Vues
Presenting Work: Graphics and Charts. Letts Chapter 14. Computer Graphics. Computer graphics refers to any pictures or graphs produced using a computer. Drawing and Design Packages. Drawing and design packages include packages for: freehand drawing and ‘painting’;

Presenting Work: Graphics and Charts
E N D
Presentation Transcript
Presenting Work: Graphics and Charts Letts Chapter 14
Computer Graphics Computer graphics refers to any pictures or graphs produced using a computer.
Drawing and Design Packages Drawing and design packages include packages for: • freehand drawing and ‘painting’; • image manipulation; • 3-D modelling; • animation.
Picture Storage Storage of pictures can be: • pixel based (bit-mapped) - a picture stored as a set of dots; • object based (vector or line) - each picture is stored as a set of shapes.
Paint Packages A paint package is a general term for any program which allows freehand drawing and colouring.
Computer Aided Design A computer aided design (CAD) system allows the user to produce accurate drawings. Hardware for CAD usually includes: • a microcomputer with a large hard disk and main store; • a graphics tablet with a stylus; • a high resolution monitor; • a plotter or at least a laser printer;
CAD and CAM • CAM is computer aided manufacture. • CAD/CAM is a CAD system integrated with a CAM system.
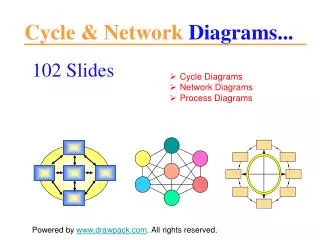
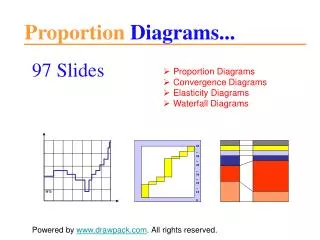
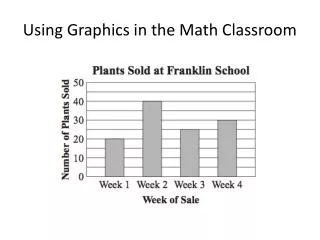
Graphs and Charts Graphs and charts are often referred to as “business graphics”. Types of graph include: • a bar chart, made up of rectangular; blocks or bars; • a pie chart, in the form of a circle with lines drawn out from the centre; • a line graph, which has a set of points joined by a line; • a scatter graph, produced when two different quantities are plotted against one another.
These types of graphs are used as follows: • bar chart - to show the relative sizes of separate values; • pie chart - to show how something is shared; • line graph - to show how a quantity is changing; • scatter graph - to show how different quantities are related;