Control Charts
Control Charts. Training Slides 02/19/01. Control Charts. Definition: - A statistical tool to determine if a process is in control. History of Control Charts. Developed in 1920’s By Dr. Walter A. Shewhart Shewhart worked for Bell Telephone Labs. Two Types of Control Charts.


Control Charts
E N D
Presentation Transcript
Control Charts Training Slides 02/19/01
Control Charts • Definition: - A statistical tool to determine if a process is in control.
History of Control Charts • Developed in 1920’s • By Dr. Walter A. Shewhart • Shewhart worked for Bell Telephone Labs
Two Types of Control Charts • Variable Control Charts • Attribute Control Charts
Variable Control Charts • Deal with items that can be measured . • Examples 1) Weight 2) Height 3) Speed 4) Volume
Types of Variable Control Charts • X-Bar chart • R chart • MA chart
Variable Control Charts • X chart: deals with a average value in a process • R chart: takes into count the range of the values • MA chart: take into count the moving average of a process
Attribute Control Charts • Control charts that factor in the quality attributes of a process to determine if the process is performing in or out of control.
Types of Attribute Control Charts • P chart • C Chart • U Chart
Attribute Control Charts • P Chart: a chart of the percent defective in each sample set. • C chart: a chart of the number of defects per unit in each sample set. • U chart: a chart of the average number of defects in each sample set.
Reasons for using Control Charts • Improve productivity • Make defects visible • Determine what process adjustments need to be made • Determine if process is “in” or “out of control
Real World Use of Control Charts • Example from “Managing Quality” by Foster. • The Sampson company develops special equipment for the United States Armed Forces. They need to use control charts to insure that they are producing a product that conforms to the proper specifications. Sampson needs to produce high tech and top of the line products, daily so they must have a process that is capable to reduce the risks of defects.
How Will Using Control Charts help your Company? • Possible Goals when using Control Charts in your Company: • Line reengineering • Increased Employee motivation • Continually improve of your process • Increased profits • Zero defects
Control Chart Key Terms • Out of Control: the process may not performing correctly • In Control: the process may be performing correctly • UCL: upper control limit • LCL: lower control limit • Average value: average
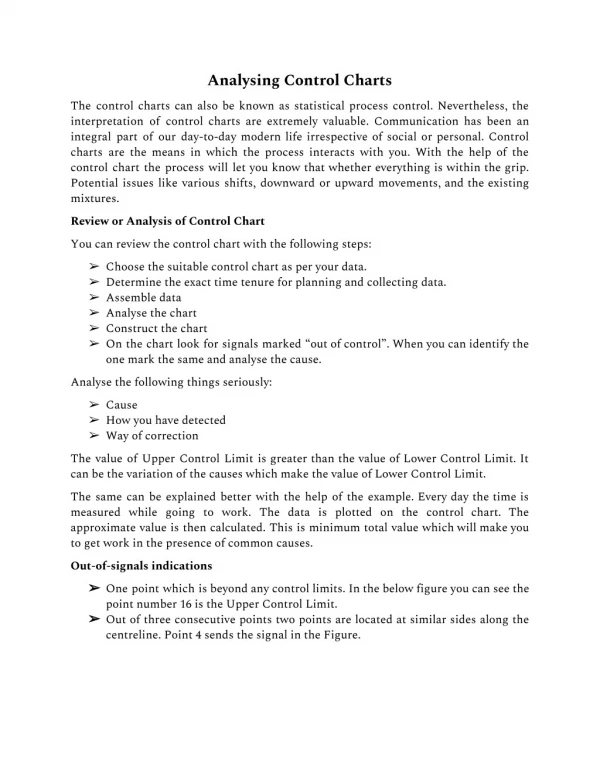
Process is OUT of control if: • One or multiple points outside the control limits • Eight points in a row above the average value • Multiple points in a row near the control limits
Process is IN control if: • The sample points fall between the control limits • There are no major trends forming, i.e.. The points vary, both above and below the average value.
Calculating Major Lines in a Control Chart • Average Value: take the average of the sample data • UCL: Multiply the Standard deviation by three. Then add that value to the Average Value. • LCL: Multiply the Standard deviation by three. Then subtract that value from the Average Value.
Control Charts • The following control chart shows the improvement of a process. The standard deviation decreases as the process becomes more capable.
How to Calculate the standard deviation • P chart: • P= percent or rate • N= number of trails
How to Calculate the standard deviation • C chart: • X= the average
How to Calculate the control limits • X-bar Chart: Lower Control Limit: • Mean – 3*sigma n(1/2) Center Line: • Process mean Upper Control Limit: • Mean + 3*sigma n(1/2)
How to Calculate the control limits • R chart: • Lower Control Limit: • R-Bar – 3*d3*sigma • Center Line: • R-Bar • Upper Control Limit: • R-Bar + 3*d3*sigma
Sample Size • The sample set of data should be greater than 28. • The data should have been collected uniformly • The data should contain multiple capable points of data, or the information is incorrect.
Example • First Step: Determine what type of data you are working with. • Second Step: Determine what type of control chart to use with your data set. • Third Step: Calculate the average and the control limits.
Example • The following slides contain data and questions for your practice with control charts. Please take the process step by step and look back to previous slides for help.
Problem • You have gathered a sample set of data for your company. The data is in the form of percents. Your company wants your recommendation, is the process in control. • What type of control chart should you use? (Variable or Attribute)
Problem • What type of specific control chart should you use with that type of sample set? (X-bar, R-chart, MA-chart, P-chart, R-chart, or U-chart)
Problem • Now that you have determined the control chart to use, you have to calculate the average and standard deviation. Use the data on the following slide. Take notice to the amount of sample data. (n>28)
Sample Data DayPercent DayPercent 1 .056 15 .068 2 .078 16 .038 3 .064 17 .077 4 .023 18 .068 5 .067 19 .053 6 .078 20 .071 7 .067 21 .037 8 .045 22 .052 9 .034 23 .072 10 .045 24 .047 11 .062 25 .042 12 .051 26 .051 13 .070 27 .064 14 .039 28 .071
Now that you have calculated the three important lines for the control chart, plot the data and determine if the process is capable. (i.e. The data falls mostly inside the UCL, and the LCL) Example
Final Step • Make a recommendation to your company. • The process is capable • The process is not capable • The following errors were found. • The process needs improvement • The variations are normal in the system and we must accept them.
Control Charts Review • What have we learned? • Control Charts are a useful way to determine the capability of a process. • The different types of control charts. • How to calculate the control limits for a control chart.
Works Cited “Control Charts as a tool in SQC.” Internet. http://deming.eng.clemson.edu/pub/tutorials/qctools/ccmain1.htm. 31 January 2001. Foster, S. Thomas. Managing Quality. Upper Saddle River: Prentice Hall, Inc. 2001. “Generating and Using Control Charts.” Internet. http://www.hanford.gov/safety/upp/spc.htm. 31 January 2001. “Quality and Statistical Process Control.” Internet. http://www.systma.com/tqmtools/ctlchtprinciples.html. 12 February 2001. “Statistical Thinking Tools-Control Charts for the Average.” Internet. http://www.robertluttman.com/yms/Week5/page6.htm. 12 February 2001.