CONTROL CHARTS
Wayne Gaul, Ph.D., CHP, CHMM Tidewater Environmental Columbia, SC SRHPS Technical Seminar, April 15, 2011. MORE THAN MEETS THE EYE. CONTROL CHARTS. Control Charts. Used to determine whether or not the process in question is stable . “Stable” refers to a state of statistical control


CONTROL CHARTS
E N D
Presentation Transcript
Wayne Gaul, Ph.D., CHP, CHMM Tidewater Environmental Columbia, SC SRHPS Technical Seminar, April 15, 2011 MORE THAN MEETS THE EYE CONTROL CHARTS
Control Charts • Used to determine whether or not the process in question is stable. • “Stable” refers to a state of statistical control • “Control” monitors a condition which exists when the process is affected by only random variation
Control Charts • Assumes that the process is stable • The estimate of used in the calculation must be reliable • Several tests for stability have been developed which use statistical probability to determine the likelihood that certain patterns of variation are the result of chance (random variation) or assignable causes (non-random variation; a sign of instability).
Caution with Standard Deviations • Standard deviation of a population: • Standard deviation of small sample size: (Used in Excel)
Want to Monitor Trends • The Control Chart monitors repeated measurements to ensure they are within limits. • The X-axis is typically time but can be batches, groups, tests, anything to compare.
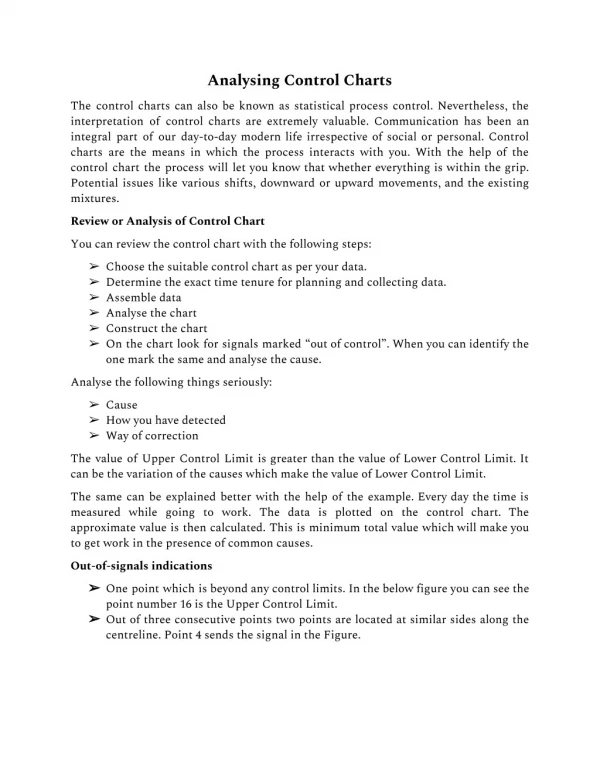
Trends Monitored with Statistical Accuracy The simplest and best known indicator is the presence of a point beyond the 3 control limits. Because in a normal distribution 99.73% of the population will fall within 3 of the mean. This means only a .27% chance that a point will fall outside those limits. In other words, there is a 99.73% chance that the points outside the limits are the result of non-random causes.
Conditional Testing • Additional tests are also based on the same sort of reasoning— • There is a significantly small probability that any of the phenomena are the result of chance alone.
Additional Tests • One point outside the 3 limits • Two out of three consecutive points more than 2 away from the mean on one side. • Four out of five consecutive points more than 1 away from the mean on one side
Additional Tests • Seven consecutive points on one side of the mean • Six consecutive points trending up or down • Fourteen consecutive points alternating up or down
Common Types of Control Charts • Often classified according to the type of quality characteristic that they are supposed to monitor: • There are quality control charts for variables, and • Quality control charts for attributes.
Control Charts for Variables • X-barchart. The sample means are plotted in order to control the mean value of a variable. • R chart. The sample ranges are plotted in order to control the variability of a variable. • S chart. The sample standard deviations are plotted in order to control the variability. • Moving Average chart. The moving average of successive samples is plotted.
Control Charts for Attributes • These are more for production processes. • C chart – plot the number of defectives per batch, day, per machine, etc, Poisson assumed. • U chart – plot the rate of defectives. # defects per # units. Good for different batch sizes. • Np chart, similar to C chart, use binomial dist. • P chart, similar to U chart, uses proportions.
Conclusion from the Alpha • Possibly two separate contamination events
Conclusions for Beta • No specific event possible to identify. • Moving average trend line gives indication an upward trend of some kind.
Conclusion • Control charts can provide meaningful information. • Must be properly used. • Multiple types may be necessary to identify possible problems.