Download
1 / 10
100 likes | 117 Vues
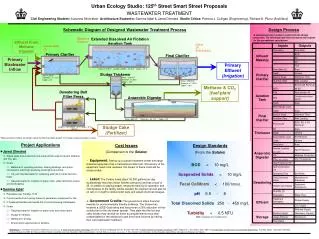
In this work, total solids reduction process was numerically modeled with<br>response surface methodology (RSM) and Artificial neural network (ANN) models.<br>The experimental data was used for training these models. Amplitude of the ultrasonic<br>waves, time of ultrasonication and total solids present in the sludge are input to the<br>model. These factors are varied to five levels and by conducting design of<br>experiments, the actual values were measured. The response surface methodology was<br>used to determine the relation between the factors and total reduction in solids. To<br>overcome the flaws in the response surface methodology, an artificial neural network<br>model is developed and the results of the ANN models are compared with RSM models<br>and experimentally measured values.

E N D
International Journal of Advanced Research in Engineering and Technology (IJARET) Volume 10, Issue 3, May-June 2019, pp. 1-10, Article ID: IJARET_10_03_001 Available online at http://www.iaeme.com/ijaret/issues.asp?JType=IJARET&VType=10&IType=3 ISSN Print: 0976-6480 and ISSN Online: 0976-6499 © IAEME Publication ANN MODEL OF WASTEWATER TREATMENT PROCESS Mallikarjuna Huggi, S.R. Mise V.T.U, Belgaum, India ABSTRACT In this work, total solids reduction process was numerically modeled with response surface methodology (RSM) and Artificial neural network (ANN) models. The experimental data was used for training these models. Amplitude of the ultrasonic waves, time of ultrasonication and total solids present in the sludge are input to the model. These factors are varied to five levels and by conducting design of experiments, the actual values were measured. The response surface methodology was used to determine the relation between the factors and total reduction in solids. To overcome the flaws in the response surface methodology, an artificial neural network model is developed and the results of the ANN models are compared with RSM models and experimentally measured values. Index Terms: Waste Water Treatment Process, Artificial Neural Networks, Ultrasonication, Sludge Treatment, Environmental Protection. Cite this Article: Mallikarjuna Huggi and S.R. Mise, ANN Model of Wastewater Treatment Process, International Journal of Advanced Research in Engineering and Technology, 10(3), 2019, pp 1-10. http://www.iaeme.com/ijaret/issues.asp?JType=IJARET&VType=10&IType=3 1. INTRODUCTION The waste water treatment plants produce waste water sludge and it can be used in many value added applications. The value added applications results in beneficial use of sludge. The usage of sludge in land application to improve the fertility of the land is considered as beneficial to the farmers as well as to the nature. These methods of using the sludge in the value added applications in land fertility improvement are more advantageous than traditional methods of sludge disposal. In traditional methods, the sludge is disposed by filling the land or by burning it. The burning of sludge in fact is detrimental to the environment since it releases toxic gasses that are harmful to the environment. However, the sludge is not considered as an alternate material to improve the land fertility due to the reason that it has low nutrient content. The wastewater sludge has some of the complex compounds which are insoluble and sometime gets trapped as suspended solids. Sometimes, insoluble complex compounds may be absorbed at the surface. Hence some treatment is required for the wastewater sludge in order to modify it physical, chemical and biological properties to convert the complex insoluble compounds into a simpler soluble forms. When some http://www.iaeme.com/IJARET/index.asp 1 editor@iaeme.com
Mallikarjuna Huggi and S.R. Mise components of sludge is made completely soluble or at least partially soluble, then its nutrient content that is soluble in the soil increases thereby increasing fertility of the land. The biodegradability of the sludge can be enhanced by various means. Notable among them are: Advanced oxidation processes [1] Thermal and thermo-chemical hydrolysis [2] Mechanical sludge disintegration [3] Ultrasonic disintegration [4] Ultrasonic disintegration has gained popularity over years and it was used successfully in many applications of wastewater sludge treatment [5, 6]. In ultrasonic disintegration, intercellular material is extracted by disrupting the microbial cells. It is achieved by passing the ultrasonic pressure wave through the medium. When the pressure wave passes through the medium, huge amount of energy is dissipated and creates violent movements of vacuum or gas bubbles. This will in turn generate bio-physical-chemical effects on the medium [7]. This process is known as acoustic cavitations. This high magnitude hydro-mechanical forces cause disrupts the cells in the sludge resulting in the release of organic material and liquid sludge [8]. Efficiency of this ultrasonic process is high at 100kHz [9] as the Sono-chemical reactions are more violent at this frequency. This will release more organic substances by creating more reactive radicals. Increase in efficiency was also noticed when the temperature of the ultrasonic integration process was increased [10]. Other important research works in this domain can be found in [11-19]. The RSM methodology that was used to estimate the total solids reduction was not enough as there were significant errors in the prediction. Hence it is required to develop a new approach to address the issue of errors. Objective of this research work is to propose a new approach to overcome the flaws in the RSM. Since there were non-linear relationships exist among the factors, the RSM was not able to account for the non-linearity. Hence in this work, a new methodology was adopted to model the solid reduction process by using ANNs. Though ANNs are not new to the research community, it is novel in the application of waste water treatment processes. In the next section, mathematical formulation is laid out for the artificial neural networks. The structure of the ANN along with various activation functions that can be used in ANN are listed down. In Sec III, simulation results are presented along with the experimental results that were collected as part of the research work in [11]. The RSM and ANN results are compared with the experimentally measured values. In Sec. IV, important conclusions are drawn. 2. MATHEMATICAL FORMULATION Artificial neural networks (ANN) are formed by connecting artificial neurons. Each neuron performs a mathematical operation. The neurons are arranged in an order in the form a layer. Each layer has a finite number of neurons. Input layer of neurons has number of neurons equal to the number of dimensions in the input data. When the connections are formed in only one direction from the input to output without forming cycles, then it is known as feed forward neural network. The information always moves only in one direction from input to output layer. The simplest form of ANNs is single layer perceptron neural networks. In this type of neural networks, there is only one layer of neuron. The neurons are arranged only in the output layer. The input is directly fed to the output layer. There is no input or hidden layers in this type of neural networks. http://www.iaeme.com/IJARET/index.asp 2 editor@iaeme.com
ANN Model of Wastewater Treatment Process Output Output Layer Hidden Layers Figure 1.1 Generalized Feed Forward Neural Network In a multi layer perceptron neural networks, as shown in Fig. 1.1, there are input layer, hidden layer and output layers. The number of hidden layers in the ANN is considered as the size of the ANN. For example, if the number of hidden layers is two, then the size of ANN is two layers. Every neuron in the input layer is connected to the every neuron in the next hidden layer. For example, if there are 5 neurons in the input layer, and 6 neurons in the next hidden layer, then there are 30 connections between input and first hidden layer. Every connection has a weight associated with it. At every neuron in hidden and output layer, all the inputs coming from the previous layers are added after multiplying with weights of the connections and with a bias. (1) ...... w Eq, 1 shows the summations of products of the weights and the inputs and addition of a bias. The Z value is input to an activation function to map the value into a range. For example, the value of Z can be mapped to a range of 0 to 1 or -1 to +1 or 0 to the positive value of Z itself. Therefore, Z w x w x w nx 0 1 1 2 2 n (2) Y (Z ) g The function g(Z) is known as activation function. If the range of values for Z after mapping with the activation function, is chosen to be between 0 and 1, then Sigmoid Function is used as activation function. If the range is between -1 to +1, then Hyperbolic Tangent Function (Tanh) is used. Similarly, if the range is between zero to positive value of Z itself, then Rectified Linear Unit (ReLU) is used as activation function. 1 Sigmoid Function: (3) Y z 1 e 2 z 1 e Hyperbolic Tangent Function: (4) Y 2 z 1 e Y ReLU: max , 0 ( ) . (5) Z In the present work the sigmoid function is used at every neuron in hidden and output layers; and the output of one neuron becomes one of the inputs to the neuron of next layer. Finally, the output layer has only one neuron and it provides the output between the values 0 http://www.iaeme.com/IJARET/index.asp 3 editor@iaeme.com
Mallikarjuna Huggi and S.R. Mise and 1. Based on the difference of the output for a given set of inputs, the error is computed and the error is back propagated to adjust the weights of the neuron. This iterative process continues until all weights are adjusted so that there is no difference between the computed value at the output neuron and actual values. This process is repeated for all the inputs and is called as training of the ANN. 3. THE SIMULATION RESULTS In this section numerical results are presented for the simulation of replacing the experiments with the ANN model. The actual measurements carried in [11] are used to measure the performance of ANN. The ultrasonfication was performed with 750W homogenizer that operates on ultrasonic principles. The power supplied was 225W and operated the ultrasonic homogenizer at a frequency of 20kHz. The probe used in the ultrasonic homogenizer was made out of platinum with a tip diameter of 25mm. From this experiment, 400 milli liters of wastewater sludge was taken in a beaker of size one liter. The beaker was maintained at ambient temperature. The platinum probe tip was dipped 20 millimeters into the wastewater sludge in the beaker. The efficiency of the process was estimated by improvement in the solubilization of sludge organic matter. The improvement is measured as ratio of soluble and total demand of chemical oxygen. Also biodegradability in aerobic degradation process is measured. In ref [11], the results of above experiment is presented using the design of experiments (DoE) and the results were correlated with response surface methodology (RSM). Three variables, namely, amplitude of ultrasonic waves, time for ultrasonic treatment and the amount of solids present in the solution are used in the model. These three variables are considered as the significant variables and percent solid reduction was measured experimentally for different levels of these variables. Five levels of these three factors are presented in the Table 1. The central composite design was used to determine the significant factors in the optimization of these factors. Table 1 Factors and Levels used in the design of experiments Factor Amplitude Time (min) Total solids (g/L) Level 0 40 60 Symbol X1 X2 -2 32 43 -1 35 50 1 45 70 2 48 77 X3 10 15 23 31 36 Source: Ref [11] http://www.iaeme.com/IJARET/index.asp 4 editor@iaeme.com
ANN Model of Wastewater Treatment Process Table 2 Percent Solid Reduction resulted from the experiment Measure d Value in % 36 33.33 30 28 35.65 25.65 35.22 29.03 30.87 28.7 30.87 22.61 21 26.39 16.09 20 13.48 21.3 18.7 16.07 Experime nt # X1 X2 X3 1 2 3 4 5 6 7 8 9 10 11 12 13 14 15 16 17 18 19 20 -1 1 -1 1 -1 -1 1 1 -2 2 0 0 0 0 0 0 0 0 0 0 -1 -1 1 1 -1 1 -1 1 0 0 -2 2 0 0 0 0 0 0 0 0 -1 -1 -1 -1 1 1 1 1 0 0 0 0 -2 2 0 0 0 0 0 0 Source: Ref [11] Based on the experiments conducted, the percent solid reduction obtained is presented in the Table 2. Based on the results obtained, using the surface response methodology, the data was fitted to the equation using ANOVA. n n n n 2 1 Y X X X X (6) 0 i i ii i ij i j 1 1 1 i i i j Table 3 shows the predictions made by the RSM model. It can be observed that while there is close agreement between the RSM predictions and actual measurements, it is not enough since there is huge gap in results of experiments 4, 8 and 12 as shown in Fig. 1. Hence another advanced artificial intelligence tools are leveraged for this purpose. In this research work, a new methodology was adopted using the artificial neural networks, in order to determine the optimum levels of the factors for the percent solid reduction. The difference between the response surface methodology (RSM) and the artificial neural networks (ANN) is: the ANN models the non linear relations between the factors very effectively than the response surface methodology (RSM). http://www.iaeme.com/IJARET/index.asp 5 editor@iaeme.com
Mallikarjuna Huggi and S.R. Mise Table 3 Results predicted by RSM Predicted Value in % from Response Surface Methodolog y (RSM) 34.05 32.14 26.12 26.39 34.42 26.7 33.69 28.15 28.15 29.01 31.45 25.95 24.97 26.7 17.39 17.39 17.39 17.39 17.39 17.39 Differenc e between Measured Value and RSM Measure d Value in % Experime nt # X1 X2 X3 1 2 3 4 5 6 7 8 9 10 11 12 13 14 15 16 17 18 19 20 -1 1 -1 1 -1 -1 1 1 -2 2 0 0 0 0 0 0 0 0 0 0 -1 -1 1 1 -1 1 -1 1 0 0 -2 2 0 0 0 0 0 0 0 0 -1 -1 -1 -1 1 1 1 1 0 0 0 0 -2 2 0 0 0 0 0 0 36 1.95 1.19 3.88 1.61 1.23 -1.05 1.53 0.88 2.72 -0.31 -0.58 -3.34 -3.97 -0.31 -1.3 2.61 -3.91 3.91 1.31 -1.32 33.33 30 28 35.65 25.65 35.22 29.03 30.87 28.7 30.87 22.61 21 26.39 16.09 20 13.48 21.3 18.7 16.07 Source: Ref [11] Figure 1: Comparison of prediction using RSM with actual measurements of solids reduction. The model used in the ANN has an input layer with three input neurons and a hidden layer with five neurons. The output layer has one output neuron which predicts the output of the process. The weights of the neurons are optimized using the back propagation algorithm. Once the neural network is trained on the experimental data, the model can be used for any combination of the input factors and its levels. The output of the model is just the weights of the neurons. The ANN was trained with two levels, one with 5000 epochs and the other with 10000 epochs. Table 4 shows the results predicted by the ANN model with 5000 epochs. Fig. 2 shows the comparison of ANN-5000 epochs predicted results with the actual measurements. It can be noticed that there is a very close agreement of the ANN-5000 epochs predicted results with the experimental measurements. The ANN predicted results are closer to the http://www.iaeme.com/IJARET/index.asp 6 editor@iaeme.com
ANN Model of Wastewater Treatment Process actual results than the RSM model. However, at experiment 2 and 10, there is still some difference in the percentage values between actual and predicted results. Table 4 Results predicted by ANN-5000 Epochs Predicted Value from Artificial Neural Networks (ANN) with 5000 Epochs 35.81 31.33 30.04 28.07 35.44 25.47 35.00 29.14 30.77 31.37 30.77 22.35 20.96 26.31 17.26 17.26 17.26 17.26 17.26 17.26 Difference between Measured Value and ANN- 5000 Epochs Measured Value in % Experiment # X1 X2 X3 1 2 3 4 5 6 7 8 9 10 11 12 13 14 15 16 17 18 19 20 -1 1 -1 1 -1 -1 1 1 -2 2 0 0 0 0 0 0 0 0 0 0 -1 -1 1 1 -1 1 -1 1 0 0 -2 2 0 0 0 0 0 0 0 0 -1 -1 -1 -1 1 1 1 1 0 0 0 0 -2 2 0 0 0 0 0 0 36 0.19 2.00 -0.04 -0.07 0.21 0.18 0.22 -0.11 0.10 -2.67 0.10 0.26 0.04 0.08 -1.17 2.74 -3.78 4.04 1.44 -1.19 33.33 30 28 35.65 25.65 35.22 29.03 30.87 28.7 30.87 22.61 21 26.39 16.09 20 13.48 21.3 18.7 16.07 Figure 2 Comparison of prediction using ANN-5000 epochs with actual measurements. To overcome this problem, the number of epochs was increased to 10000 epochs from 5000 epochs. Higher the number of epochs, model over fits on the data. Hence the number of epochs was not increased beyond 10000. Model with 10000 epochs has improved the results compared to the model with 5000 epochs. Table 5 shows the results of the ANN-10000 http://www.iaeme.com/IJARET/index.asp 7 editor@iaeme.com
Mallikarjuna Huggi and S.R. Mise Epochs and RSM methods predicting the optimal levels of the factors for the maximum percent solid reduction. Table 5 Results predicted by ANN-10000 Epochs Predicted Value from Artificial Neural Networks (ANN) with 10000 Epochs 36.00 33.33 29.99 27.99 35.65 25.71 35.26 29.05 30.85 28.69 30.73 22.72 20.81 26.41 17.73 17.73 17.73 17.73 17.73 17.73 Measu red Value in % Difference between Measured Value and ANN-10000 Epochs 0.00 0.00 0.01 0.01 0.00 -0.06 -0.04 -0.02 0.02 0.01 0.14 -0.11 0.19 -0.02 -1.64 2.27 -4.25 3.57 0.97 -1.66 Experime nt # X1 X2 X3 1 2 3 4 5 6 7 8 9 10 11 12 13 14 15 16 17 18 19 20 -1 1 -1 1 -1 -1 1 1 -2 2 0 0 0 0 0 0 0 0 0 0 -1 -1 1 1 -1 1 -1 1 0 0 -2 2 0 0 0 0 0 0 0 0 -1 -1 -1 -1 1 1 1 1 0 0 0 0 -2 2 0 0 0 0 0 0 36 33.33 30 28 35.65 25.65 35.22 29.03 30.87 28.7 30.87 22.61 21 26.39 16.09 20 13.48 21.3 18.7 16.07 Figure 3 Comparison of prediction using ANN-10000 epochs with actual measurements. It can be observed from Table 5 and Fig. 3 that, the ANN-10000 Epochs model has predicted the results more accurately than RSM and ANN-5000 Epochs. There is a difference in predicted and actual values beyond experiment 15. This is due to the reason the actual values from experiment 1 to 15 were used to train the ANN and the values from experiment 16 to 20 were used as a validation set. The train set was again input to the final ANN model to predict the results. Since the train set was already input to the ANN model at the time of training, the predicted results from experiment 1 to 15 have very good agreement. Since the attributes beyond experiment 15 is not input to ANN at any time, it is showing generalization of the model. http://www.iaeme.com/IJARET/index.asp 8 editor@iaeme.com
ANN Model of Wastewater Treatment Process Figure 4 Comparison of errors in predictions using RSM, ANN-5000 and ANN-10000 Epochs. From Fig. 4, it is clear that when the errors between the predicted values and experimental results were compared, the ANN-10000 Epochs model has error almost zero for the experiments 1 to 15. The error is high beyond the experiments 15 since the attributes of experiments 16 to 20 are not part of the training data and high error is due to generalization. From the Tables 3-5, it can be observed that for amplitude of 35%, time of 50 min and total solids of 15g/L, the percent solid reduction was 34.05 by the RSM and that by the ANN is 35.8%. The ANN result is very close to the experimentally observed value i.e. 36%. It can be observed that the when the number of epochs are increased from 5000 to 10000, the ANN results becomes very close to the actual results and hence there is an improvement in the predicted values in terms of accuracy. 4. CONCLUSION The RSM has predicted the optimal combination of amplitude of 35%, time of 50 min and total solids of 31g/L where the maximum percent solid reduction was obtained at 34.05%, which is not true as per the experimentally measured value of 36% since this value corresponds to the level of amplitude of 35%, time of 50 min and total solids of 15g/L. The total solids combination was predicted to be at 31g/L instead of 15g/L as per the RSM model for the maximum percent solid reduction. This flaw in the RSM prediction is overcome in the proposed ANN model. The ANN model, instead predicted the right combinations for the maximum percent solid reduction that is good in agreement with the experimentally observed values. In case of both 5000 epochs and 10000 epochs, the best combination of the levels of the factors is amplitude of 35%, time of 50 min and total solids of 15g/L, the percent solid reduction was 35.8% and 36% respectively. Hence it can be concluded that the ANN can be treated as a better model for estimating the optimal combination for the maximum percent solid reduction. REFERENCES [1] Neyens E., Baeyens J. (2003). A review of classic Fenton’s peroxidation as an advanced technique, Journal of Hazadous Materials, B98, 35–50. Vlyssides A.G., Karlis P.K. (2004). Thermal-alkaline solubilisation of waste activated sludge as a pretreatment stage for anaerobic digestion. Bioresource Technology, 91, 201-206. Camacho P., Deleris S., Geaugey V., Ginestet P. And Paul E. (2002). A comparative study between mechanical, thermal and oxidative disintegration techniques of waste activated sludge. Water Science and Technology, 46(10), 79–87. [2] [3] http://www.iaeme.com/IJARET/index.asp 9 editor@iaeme.com
Mallikarjuna Huggi and S.R. Mise [4] Harrison, S.T.L. 1991. Bacterial cell disruption: a key unit operation in the recovery of intracellular products. Biotechnol. Adv. 9: 217–240. doi:10.1016/0734-9750(91)90005-G. PMID:14548738. [5] Chiu Ying-Chih, Chang Cheng-Nan, Lin Jih-Gaw, Huang Shwu-Jiuan. (1997). Alkaline and ultrasonic pre-treatment of sludge before anaerobic digestion. Water Science and Technology, 36 (11), 155-162 Chu C. P., Chang Bea-Ven, Liao G.S., Jean D. S., Lee D. J. (2001). Observations on changes in ultrasonically treated waste-activated sludge. Water Research, 35(4), 1038-1046. Tiehm A., Nickel K., Zellhorn M., Neis U. (2001). Ultrasonic waste activated sludge disintegration for improving anaerobic stabilization. Wat. Res., 35(8), 2003-2009. Onyeche T.I., Schaläfer O., Bormann, Schröder C. and Sievers M. (2002). Ultrasonic cell disruption of stabilised sludge with subsequent anaerobic digestion. Ultrasonics, 40, 31-35. Hua I. and Hoffmann M.R. (1997). Optimization of ultrasonic irradiation as an advanced oxidation technology. Environ. Sci. Technol, 31, 2237–2243. Wang Fen, Wang Yong, Ji Min. (2005). Mechanisms and kinetics models for ultrasonic waste activated sludge disintegration. J. Hazadours Materials, B123, 145-150. Pham, T.T.H, Barnabé, S, Verma. M. and Tyagi. R.D. optimization of ultrasonication treatment process for improvement of wastewater sludge biodegradability using response surface methodology. oms.org/bvsaar/cdlodos/pdf/optimizationofultrasonication759.pdf. Bourgrier C., Carrère H. and Delgenès J.P. (2005). Solubilization of waste-activated sludge by ultrasonic treatment. Chemical Engineering Journal, 106, 163–169. Bien, J., and Wolny, L. 1997. Changes of some sewage sludge parameters prepared with an ultrasonic field. Water Sci. Technol. 36: 101–106. doi:10.1016/S0273-1223(97)00675-6. Bien, J.B., Kempa, E.S., and Bien, J.D. 1997. Influence of ultrasonic field on structure and parameters of sewage sludge for dewatering process. Water Sci. Technol. 36: 287–291. doi:10.1016/ S0273-1223(97)00444-7. Blume, T., and Neis, U. 2004. Improved wastewater disinfection by ultrasonic pre-treatment. Ultrason. Sonochem. 11: 333–336. PMID: 15157865. Blume, T., Martinez, I., and Neis, U. 2002. Wastewater disinfection using ultrasound and UV light. In Ultrasound in Environmental Engineering II. Technical University Hamburg-Harburg. Reports on Sanitary Engineering 35. ISSN 0724–0783, ISNB 3–930400– 47–2. GFEU-Verlag, Germany. pp. 117–127. Jung, M., Weise, Th.H.G.G., Wittenberg, M., Muller, J.A., and Dichtl, N. 2001. Sludge disintegration by electrical shock waves. In Proceedings of the International Conference on Pulsed Power Applications, Gelsenkirchen. March 27–29, 2001. pp. B.O1/1–6. King, R.O., and Forster, C.F. 1990. Effects of sonication on activated sludge. Enzyme Microb. Technol. 12: 109–115. Doi:10. 1016/0141-0229(90)90082-2. Lafitte-Trouque, S., and Forster, C.F. 2002. The use of ultrasound and ? -irradiation as pre- treatments for the anaerobic digestion of waste activated sludge at mesophilic and thermophilic temperatures. Bioresour. Technol. 8524(02)00038-X. PMID: 12139327. [5] [6] [7] [8] [9] [10] [11] http://www.bvsde.ops- [12] [13] [14] [15] [16] [17] [18] [19] 84: 113–118.doi:10.1016/S0960- http://www.iaeme.com/IJARET/index.asp 10 editor@iaeme.com