Download
1 / 14
140 likes | 146 Vues
Urban open green spaces have an important role in today's health<br>problems and the necessity for the urban health to create green areas that<br>have high accessibility for all citizens. Acceleration of urbanization in recent<br>decades decays balance of green areas and impervious surfaces in cities<br>because of rent seeking society. The main problem associated with<br>adequate provision of green area and fair access for residents. According<br>to the u201cSpatial Planning Policy Frameworku201d the green area per capita in<br>urban area (10 mu00b2), Ku0131rklareli doesnu2019t provide green space per capita. The<br>aim of the study is to identify the socio-psychological effects of the green<br>areas in the Kirklareli. Objectives of the study is to determine the correlation<br>between socio- psychological criterias with green space accesiblity, per<br>capita and visiting time and to discuss the findings rationale. The following<br>hypothesis was proposed u201curban green areas on inhabitants have positive<br>effects on human health, quality of life and stressu201d. In this context, a survey<br>was conducted to analyze the socio-psychological effects of urban green<br>spaces in Kirklareli. Expected outcome of the study is that green areas are<br>associated with positive emotions, green space per capita and accessibility<br>that can assist to decrease inequalities in health.<br>JOURNAL OF CONTEMPORARY URBAN AFFAIRS (2020), 4(1), 47-60.<br> https://doi.org/10.25034/ijcua.2020.v4n1-5

E N D
Journal ofContemporary Urban Affairs 2020, Volume 4, Number 1, pages 47– 60 Socio-Psychological Effects of Urban Green Areas: Case of Kirklareli City Center *1Dr. Ezgi TOK ,2M.Sc. Merve GÜROĞLU AĞDAŞ , 3M.Sc. Mete Korhan ÖZKÖK ,4M.Sc. Azem KURU 1, 2, 3 and 4 Faculty of Architecture, Kirklareli University, Kirklareli, Turkey 1 E mail: ezgitok@gmail.com , 2 E mail: merveguroglu@gmail.com , 3 E mail: metekorhanozkok@gmail.com , 4 E mail: azemkuru@gmail.com A B S T R A C T Urban open green spaces have an important role in today's health problems and the necessity for the urban health to create green areas that have high accessibility for all citizens. Acceleration of urbanization in recent decades decays balance of green areas and impervious surfaces in cities because of rent seeking society. The main problem associated with adequate provision of green area and fair access for residents. According to the “Spatial Planning Policy Framework” the green area per capita in urban area (10 m²), Kırklareli doesn’t provide green space per capita. The aim of the study is to identify the socio-psychological effects of the green areas in the Kirklareli. Objectives of the study is to determine the correlation between socio- psychological criterias with green space accesiblity, per capita and visiting time and to discuss the findings rationale. The following hypothesis was proposed “urban green areas on inhabitants have positive effects on human health, quality of life and stress”. In this context, a survey was conducted to analyze the socio-psychological effects of urban green spaces in Kirklareli. Expected outcome of the study is that green areas are associated with positive emotions, green space per capita and accessibility that can assist to decrease inequalities in health. JOURNAL OF CONTEMPORARY URBAN AFFAIRS (2020), 4(1), 47-60. https://doi.org/10.25034/ijcua.2020.v4n1-5 A R T I C L E I N F O: Article history: Received 20 April 2019 Accepted 6 June 2019 Available online 30 August 2019 Keywords: Keywords: Green Spaces; Socio-Psychological Effect; Urban Planning; Urban Health. This work is licensed under a Creative Commons Attribution - NonCommercial - NoDerivs 4.0. "CC-BY-NC-ND" This article is published with Open Access at www.ijcua.com www.ijcua.com Copyright © 2019 Journal of Contemporary Urban Affairs. All rights reserved. 1. Introduction Historically, from the beginning of the 20th century, there has been an awareness of the importance of green space in urban planning (Verheij et al., 2008). However, the population growth rates have been increasing exponently, natural and semi- natural areas (agriculture, pasture, forest and urban green areas) are under pressure in urban fringe (Martinez-Gonzalez et al., 2001). As a result of this situation, green space per capita and accessibility to urban green space decrease, therefore presence of open and green areas is needed more than ever before. Due to the adverse effects of the decline in the areal size of urban green space in the urban areas, studies on the effects of green areas on urban health have started to be carried out (Cicea and Pîrlogea, 2011). *Corresponding Author: Faculty of Architecture, Kirklareli University, Kirklareli, Turkey Email address: ezgitok@gmail.com How to Citethis Article: Tok, E , Ağdaş, M.G., Özkök, M.K and Kuru, A. (2020). Socio-Psychological Effects of Urban Green Areas: Case of Kirklareli City Center. Journal of Contemporary Urban Affairs, 4(1), 47-60. https://doi.org/10.25034/ijcua.2020.v4n1-5
JOURNAL OF CONTEMPORARY URBAN AFFAIRS, 4(1), 47-60/ 2020 Today, physical inactivity has become a global health problem that the World Health Organization emphasizes as a risk factor. Although life-styles vary from region to region, in some countries the rate of inactivity is about 80%. However, regular physical activity is associated with heart disease, diabetes, breast-cancer risk, mental health and quality of life. For that reason, it is vital that all nations should provide the opportunity of safe and accessible environments to be physically active in their daily lives in order to improve their personal and social health to ensure their social, economic and cultural development. In this context, the world health organization has identified the draft global vision for 2018-2030 as “more active people for a healthier world”. One of the action plans to achieve this goal has been identified as strengthening the access chances of all individuals of all ages to high quality public and open green areas, recreation areas, sports facilities (WHO, 2018). Urban green areas are considered as the main environment providing opportunities for various physical activities for cities (Koohsari et al., 2015). In the zoning regulation, green areas are defined as green spaces that include the playpen, playground, resting, recreational areas, which are reserved for society to benefit (Planned Areas Zoning Regulation, 2017). The urban green and open areas are designed in a certain hierarchy according to their variety and qualities. These can be listed as; children's playground, small scale neighborhood unit park, neighborhood and urban parks, regional parks and national parks. The neighborhood parks could have children's playgrounds, parks, sports areas and passive green space activities (Ersoy, 2015). Urban open and green areas should be accessible to pedestrians at neighborhood and subscales (Ersoy, 2015; Aydemir, 2004). The areal size should be suitable for their intended use, and they should be ergonomic, safe, aesthetic and accessible to all layers of society, (Aydemir, 2004). The level of physical activity, asphalt roads, playgrounds (Kaczynski et al., 2008), woodland areas, water elements (Kaczynski et al., 2008; Schipperijn et al., 2013), lighting, walking and cycling routes, bicycle landscape, the size of the green area (Schipperijn et al., 2013), safety (Maas et al., 2009). Studies on the positive effects of open and green areas on individuals gain importance (Martinez- Gonzalez et al., 2001). The quality of life in cities mostly depends on the availability of attractive and accessible green areas. There is a common consensus on the necessity of urban green areas for the health and happiness of individuals (Cicea and Pîrlogea, 2011). Green area and health has a positive relationship (Ersoy, 2015; Maas et al., 2009). Studies have pointed out that relation between green areas and human health affect quality of life and stress- reduction. The use of green areas contributes positively to coping with stress and green areas play a key role in designing healthy environments in cities. In the last thirty years, it has been exposed that the healing effect of urban green areas has been found in terms of public health and it has been observed that there is a positive correlation to decline stress and mental exhaustion between how often individuals use green areas and how much time they spend in green areas (Grahn et al., 2003; Nielsen and Hansen, 2007; Stigsdotter et al., 2010). In general, the benefits of green areas; Socially; provides social interaction (Ersoy, 2015; Cicea and Pîrlogea, 2011; Maas et al., 2009; Verheij etal., 2008; Aydemir, 2004; Oktay, 1998), opportunity to meet with nature (Kremer et al., 2016), physical activity (Verheij et al., 2008), promotes public health (Ersoy, 2015; Cicea and Pîrlogea, 2011), stress-reducement (Honold et al., 2016 ; Ersoy, 2015; Cicea and Pîrlogea, 2011; Verheij et al., 2008; Kaplan, 2001), prevents from depression (Bratman et al., 2015), helps to get rid of fatigue (Verheij et al., 2008), aesthetic to the built environment (Cicea and Pîrlogea, 2011; Aydemir, 2004), activities for recreation and entertainment and the chance to escape the city life (Aydemir, 2004). Moreover it has many ecological benefits. These benefits include oxygen production, dust and bacteriological treatment of the atmosphere (Ersoy, 2015; Cicea and Pîrlogea, 2011), reduction of gases causing air pollution (Ersoy, 2015), shading areas, noise reduction (Cicea and Pîrlogea, 2011), climatic control (Shishegar, 2014; Cicea and Pîrlogea, 2011, Aydemir, 2004; Oktay, 1998), preservation and maintenance vegetation (Cicea and Pîrlogea, 2011, Aydemir, 2004; Oktay, 1998), and regulation of ecosystem services (Shishegar, 2014, Roberts et al., 2019). Green areas add economic identity to the city (Cicea and Pîrlogea, 2011; Aydemir, 2004), attracts investment, increases the value of urban space and housing (Cicea and Pîrlogea, 2011), makes positive contributions such as attracting tourists (Cicea and Pîrlogea, 2011; Aydemir, 2004 ). The interaction between man and nature is beneficial for the health and happiness of individuals (Fuller and Gaston, 2009; Roberts et al., 2019). Being in natural environments positively affects blood pressure, cholesterol and stress reduction, and has a positive specific relationship with mental health and cardiovascular diseases (Bedimo-Rung et al., 2005). Interaction with nature can take place by watching a natural landscape or by being in a walking, picnic and of local parking, beautiful Dr. Ezgi TOK., et al., 48
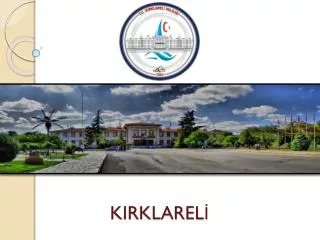
JOURNAL OF CONTEMPORARY URBAN AFFAIRS, 4(1), 47-60/ 2020 natural environment (Huynh et al., 2013). Urban green areas in cities have many benefits in terms of health (Fuller and Gaston, 2009; Roberts et al., 2019; Lee and Maheswaran, 2010; Alcock et al., 2014; Soga and Gaston, 2016) and well-being (Fuller and Gaston, 2009; Soga and Gaston, 2016; Roberts et al., 2019), and it is found that living in a close proximity to the green area has a reducing effecton heart and (Villeneuve, et al., 2012; Tamosiunas et al., 2014) and there is a positive relationship between the higher level of physical activity (Cohen et al., 2007; Toftager et al., 2011) and the frequency of green areas usage (Cohen et al., 2007; Akpınar, 2014; Nielsen and Hansen, 2007). The potential benefits from open green areas are becoming vital in cities where green areas are threatened by urbanisation (Dallimer et al., 2011). There are various evidences that areal size of green space near residential area is clearly correlated with physical activity (Bancroft et al., 2015; Paquet et al., 2013) among individuals with low stress levels (Fan et al., 2011), mental health (Gascon et al., 2015; Van den Berg, et al., 2015) happiness, and general health (Maas, 2006; Verheij et al., 2008). The areal size of green space also has a positive influence on loneliness, social support, especially for children, the elderly and individuals with low level economic status (Maas et al., 2009). There is a positive link between how often the green areas are visited, how much time is spent and the healing / decrease of stress and depression symptoms (Bedimo-Rung et al., 2005). It is determined that there was a direct relationship with the green area in terms of quality of life and health (Grahn et al., 2003; Nielsen and Hansen, 2007; Stigsdotter et al., 2010). People living in the green area more than 1 kilometer closeness use open and green areas to do excercises less than the individuals living in the green area less than 300 meters (Toftager et al., 2011). It is determined that the individuals who has an accessibility to green areas within a radius of 1-3 kilometers feel themselves healthier compared to individuals living far away from green areas (Maas, 2006; Verheij et al., 2008). Spatial planning regulation states that urban open and green spaces such as playgrounds, sports areas, and urban parks should be planned with in the service area of 500 meters, which is accessible unit for pedestrians (Spatial Planning Regulation, 2014). %92 of the total population lives in urban areas according to the Turkish Statistical Institution data of 2018. Therefore, urban areas have dense population which lead destructive pressure on urban green areas throughout the cities. The aim of this study is to determine the socio- psychological effects of the functions and areal size of open green areas in Kirklareli, and to discuss the current status after the spatial analysis. In other words, the functional uses of the green areas and their spatial qualification were measured in Kırklareli. In the considerations of urban open and green areas, although the open and green area standard in the current zoning legislation green area per capita should be 10 m², it was calculated in the present settlement areas in Kırklareli are less than 10 m2 and the green areas are not sufficient and qualified in terms of size and reinforcement. In this context, the aim of this study is to analyze the possible psychosocial consequences and to develop socio-spatial approaches. In this context, the following correlations were examined; • the proximity and the visiting time in the green area • the frequency of green space usage and mood • satisfaction of size of green area and the frequency of green area usage and visiting time The following hypotheses were tested. The frequency of use and spending time rises as the areal size of green area increases Emotionally positive feelings rise as the time spending increases User profiles and needs of these urban green areas were defined by the survey study. Spatial analysis were conducted and spatial suggestions were developed to increase the use of green areas in the city center by considering the user satisfaction and needs. 2. Study Area Kirklareli Province is located in transition area of the southern Thrace Region of Turkey. The province has borders with Bulgaria to the north, Black Sea to the east, Istanbul to the southeast, Tekirdag to the south and Edirne to the west (Figure 1). It has a land area of 6550 km² with an altitude of 203 meters above the sea level, a continental climate system and a total population of 351 684 (TURKSTAT, 2016). Kırklareli city center, which is chosen as the study area, is located in the central part of Kırklareli province between 41 ° 50 'North Latitudes and 27 ° 20' East Longitude (Figure 1). The amount of build up area in 2018 is about 868 hectares. respiratory diseases Dr. Ezgi TOK., et al., 49
JOURNAL OF CONTEMPORARY URBAN AFFAIRS, 4(1), 47-60/ 2020 Figure 1. Location Map of Study Area. Kirklareli Central District has a populated by 79 093 people according to 2018 census data. The population of the central district has been growing steadily since 1965 (Figure 2). Figure 3. Urban Green Areas. Figure 2. Population Growth by Years. Total open and green areas were determined as 64.705 hectares within the built up areas in Kırklareli city center of 2018. The distribution of these areas in urban space is shown in Figures 3 and 4. Urban green and open areas compromised; the city's parks, squares, district sports areas, children's playgrounds and active open and green areas available to public use as specified in the spatial plans production regulation. The amount of open and green areas per capita was calculated as 0.8 m2. In this respect, it is seen that open and green areas per capita is 10 m2 which is specified in the same regulation. Figure 4. Amount of Urban Green Areas by Neigbourhood. 3. Method The study consists of three sections; literature study, survey application and spatial analysis (Figure 5). In the conceptual framework of the study, the literature has been extensively investigated. As a result of this study, survey questions were prepared. Frequency, crosstab and Pearson Correlation analyses were applied to the survey questions. The flowchart of the study is shown below. Dr. Ezgi TOK., et al., 50
JOURNAL OF CONTEMPORARY URBAN AFFAIRS, 4(1), 47-60/ 2020 Figurel 5. Flowchart of the study. 3.1 Survey Application A survey was conducted to define the socio- psychological effects of urban green areas and user satisfaction. The population of Kırklareli city center is 77226 in 2017 based on Turkey Statistical Institute (TSI) Address Registration System Data (ABPRS). Accordingly, the distribution of population and number of surveys by neighborhoods is as follows (Table 1). A total of 770 survey were applied in 4% sample size and 95% confidence level (Table 1, App. 1). The number of surveys to neighborhoods was determined in proportion of population. Table 1: Kırklareli City Center Neighborhood Population and Number of Surveys Applied in the Scope of the Study. Based Population Figure 6. Number of Surveys per Neigbourhood. The questions were prepared within the scope of the study were grouped in three main category, in accordance with the literature review presented in the previous chapters. In the first category, questions were intended for evaluating users' profile. In the second category, questions were inquired about the duration of the existing park use, the purposes of use, the demands for close proximity to the parks and the factors affecting the positive / negative effects of the park use. In the third category, questions comprised about health problems and emotions. The questions in the survey were generally arranged on a closed- ended and triple Likert scale. According to the answers given to the survey about health problems, participants with mental disorders were the main focus group of the study. The other participants were evaluated as control group. The responses of the main group and the control group were evaluated in frequency and Pearson correlation analysis. Pearson Correlation analysis is a method of statistical evaluation used to examine the strength of a relationship between two, numerically measured, Pearson Product Moment correlation coefficient (abbreviated as p in text) is the measurement of correlation and ranges (depending on the correlation) between +1 and -1. +1 indicates the strongest positive correlation possible, and -1 indicates the strongest negative correlation possible (for the correlation coefficients between 0.00 and 0.25 means "too weak", the value between 0.26 and 0.49 means "weak", the value between 0.50 and 0.69 means "medium", between 0.70 and 0.89 the value means "high" and the be conducted in The highest and lowest survey percentanges in the neighborhoods are Karakas with 24% of surveys, Karacaibrahim with 15% of surveys and Dogu and Karahidir with 2% (Figure 6). continuous variables. Dr. Ezgi TOK., et al., 51
JOURNAL OF CONTEMPORARY URBAN AFFAIRS, 4(1), 47-60/ 2020 value between 0,90 and 1,00 means "too high"). But only correlations that are significant at sigf < 0.05 or 0.01 should be considered (abbreviated as sigf in text) (Zaid, 2015:4-12) 3.2 Spatial Analysis In the study, GIS and Remote Sensing technologies were used for spatial representation of green areas. Aerial photographs have a significant place in urban planning and are an important tool for meeting the changing economic, social and recreational needs of the society and for monitoring of urban development. In order to get fast and accurate results in physical planning studies, it is necessary to use aerial photographs frequently. Therefore, as a quick method and providing reliable information, aerial photographs lead to interpretations for the future in various disciplines. In this context, satellite images of 2015, obtained from the General Directorate of Mapping, were rectified according to the relevant external orientation parameters and made available for operation (Fig. 7). These maps were digitized for analyzing green areas distribution in the city. As a result of this qualitative and qualitative inquiries made about the use of urban green spaces and related spatial formation processes. Survey data were entered into the GIS environment and spatial representations were made. health problem (See App-1, Question no: 36) (Table 2, Figure 8). Table 2. Frequency Analysis of Survey Frequency Ratio (%) Disease Tension Respiratory Psychological 31 Orthopedic Internal Others Total 6 57 3 29 16 26 18 8 100 51 36 15 196 Figure 8. Disease reates by Neigbourhood According to the survey data, users (31 persons) who stated that they had psychological disorder were identified as the main group to determine the user profile, user satisfaction and socio- psychological effects of the parks and the other users defined as the control group (739 persons). In the following sections, the results will be reported in detail in the frequency tables, cross-tables and correlation evaluations. In the study, user satisfaction and socio- psychological parameters, frequency analysis were obtained and correlation tests were applied to measure the relationship strength between the factors affecting the user satisfaction and socio- psychological change. (App-1). According to this; In terms of user profile; The main and the control group is between the ages of 18-64 and has the Figure 7.Urban parks in Kırklareli city center 4. Results and Reviews Survey undercovered the current mood of the users, the mood in the park and the present health problems were determined.196 people responded positively to the question whether they had a Dr. Ezgi TOK., et al., 52
JOURNAL OF CONTEMPORARY URBAN AFFAIRS, 4(1), 47-60/ 2020 education at the secondary and higher education level. The mean age of main group is lower than the control group. In terms of user satisfaction; The main group predominantly lives in Karacaibrahim (25,8%), Karakas (22,6%) and Yayla (19,6%) Neighborhoods. The main group can access to the urban parks in the city by 5-10 minutes walking time. In the correlation test, there is a high positive relationship between the distance to the nearest green area and the time spending in the park (sigf: 0.000, p: 0.683). In the control group, it is seen that this distance is up to 15 minutes. In the correlation test, relationship between the proximity to the nearest green area and the time spending in the park (sigf: 0.000, p: 0.577). There is a negative low-level relationship (sigf: 0.000, p: -0.275) among the responses given that distance to the nearest green area or accessibility impacted on park use. The intended use of parks for main group is limited to recreational activities. On the other hand it was seen that there was a multilayered use in recreational, social and sports activities for control group. The main explanations for the usage of urban open and green areas are social activity in the Karahıdır neighborhood and recreation in other neighborhoods. The proximity of the parks is among the last reasons for useage (Figure 9). The usage frequency of urban open and green areas becomes more prominent once a week and more than once a week in all neighborhoods of the city. Daily park visiting is quite low throughout the city (Figure 10-11). The main group spends time in parks once a month or several times a week. However control group visits parks several times a week. Similarly, the main group usually uses parks less than 15 minutes, while the control group spends 15-30 minutes. In the correlation test, it is seen that the main group have a positive between visiting timein the park and the accessibility, which is negatively affected by the park use (sigf: 0.027, p: -0.411). In the control group, there is a negative low-level relationship p: -0.284) between the time spending in the park and the positive effect of accessibility to the parks. relationship there is a positive (sigf: 0.000, are positively Figure 10. Duration of Urban Green Space Usage. Figure 9. Urban Green Areas Usage. Dr. Ezgi TOK., et al., 53
JOURNAL OF CONTEMPORARY URBAN AFFAIRS, 4(1), 47-60/ 2020 about negatively affect the use of the parks. In the correlation test, it is seen that there is a high level of negative relationship (sigf: 0.000, p: -0.688) between the time spent in the park and the lack of night lighting. In the control group, the changes in the user profile of the evening is seen as the main criterion. When the cross-examination table (Table 3) was observed for the change between the current feeling and feeling in the park; In both groups, the users, who stated that they are depressed, tired and stressed in the last period, specified that they are happy, calm and peaceful in the park. In addition, the correlation test was performed for the main group, there was a positive, medium level relationship (sigf: 0.02, p: 0.410) between feeling in the park and landscape elements positively affect the use of parking. lighting and insecurity which Figure 11. Urban Green Space Usage. Both groups choose the same equipments such as buffet and food and beverage units which positively effect the use of the parks, the main group differently consider Table 2: Cross-Table in Main Group and Control Group for Current Feelings and Feelings in the Park. Main group Feeling In The Park Mood Total Energetic Tired Happy Depressed Calm and Peaceful Stressed Energetic 1 0 1 0 0 0 2 Tired 1 1 1 1 5 0 9 Happy 1 0 1 0 0 0 2 Depressed Calm and Peaceful Stressed 0 1 3 1 3 0 8 0 0 1 1 2 0 4 1 0 0 0 4 1 6 Total 4 2 7 3 14 1 31 Control group Feeling In The Park Mood Total Energetic Tired Happy Depressed Calm and Peaceful Stressed Energetic 54 4 21 4 56 5 144 Tired 38 13 33 11 107 1 203 Happy 26 10 38 5 64 3 146 Depressed Calm and Peaceful Stressed 6 4 12 8 25 5 60 18 5 25 8 52 6 114 8 3 7 7 28 6 59 Total 150 39 136 43 332 26 726 inhabitants of a city have equal rights to utilize green space and to live a healty life. Maintaining community green spaces enable health benefits for inhabitants such as resting, relieving stress, and 3. Conclusion One of the main parameters of equaility is accessibility to open green spaces that brings healtier communities. In other words, every Dr. Ezgi TOK., et al., 54
JOURNAL OF CONTEMPORARY URBAN AFFAIRS, 4(1), 47-60/ 2020 other psychological effects that also decrease environmental and health supplying them equal opportunities to use and benefit from green spaces, such as preserving from air pollution and noise. Many studies have proved relations between green areas in close proximity to residential areas and health profits affirming that spending time in green space can affect health benefits regardless of the level of physical activity. Planning, designing and managing open green spaces or network play superior roles to provide vital new chances for societies. Our study aimed to expose the correlations between the designing, planning, accessibility, mobility and well-being due to the open green space organization in Kırklareli. The study involves three parts; literature study, survey application and spatial analysis. Surveys signified that green space and health has a positive relationship and pointed out that green space affected human mental health and stress- reduction. According to the survey and spatial analysis results, the green area per capita was calculated as 0,8 m² which is very low due to the planning zone regulation. On the other hand, according to the survey results, parks have a positive psychological effect on the urban users and parks could only offer recreational aim for users with mental disorders. Although all users spend long time in parks and visit them frequently. There are common negative evaluations such as change of user profile at nights, lack of lighting, noise and pollution. In this respect, the literature framework of the study is constant with the presented information. In addition, the number and size of parks should be increased and spatial quality should be improved in order to improve urban health. In this regard, although the parks provide supportive results for the users to have a psychologically positive effect on the users; it is possible to say that parks of Kırklareli have a simple usage characteristic especially for users with psychological problems and do not satisfy them for socialization and social activities. Despite the limited use of parks in terms of the duration and type of usage for users with mental disorders, it is seen that the factors such as accessibility, lighting and landscaping elements related to the parks are more sensitive than the control group and the correlation between those factors is medium and high level. In the control group, there is no similar sensitivity level and the relations are generally low level. Therefore, it is possible to say that the design interventions in parks can influence the users with psychological disorders psychological aspects and usage profile. Acknowledgement This article supported by Kırklareli University as coordinator of Scientific Research Projects. Conflict of interests The authors declare no conflict of interest. References Akpınar, A. (2014). Kullanıcıların kentsel yeşil yolları kullanım sebepleri, algıları ve tercihlerinin Aydın/Koşuyolu örneğinde [Investigation of the reasons, perceptions and preferences of users for urban green roads in Aydın / Koşuyolu case.]Journal of the Faculty of Forestry Istanbul University, https://dx.doi.org/10.17099/jffiu.31281 Alcock, I., White, M.P., Wheeler, B.W., Fleming, L.E., & Depledge, M.H. (2014) Longitudinal effects on mental health of moving to greener and less green urban areas. Environmental Science Technology, https://doi.org/10.1021/es403688w Aydemir, S.E., (2004). Kentsel Açık ve Yeşil Alanlar- rekreasyon. Kentsel Alanların Planlanması ve Tasarımı [Urban Open and Green Areas- recreation. Planning and Design of Urban Areas](pp. 285-290), Akademi Kitabevi, Trabzon. Bancroft, C., Joshi, S., Rundle, A., Hutson, M., Chong, C., Weiss, C. C., Genkinger, J., Neckerman, K., Lovasi, G. (2015). Association of proximity and density of parks and objectively measured physical activity in the United States: A systematic review. Medicine, https://doi.org/10.1016/j.socscimed.2015.05.03 4 Bedimo-Rung A.I., Mowen A.J., & Cohen D.A. (2005). The significance of parks to physical activity and public health. a conceptual model. Preventive 68. https://doi.org/10.1016/j.amepre.2004.10.02 4 Bratman, G.N., Hamilton, J.P., Hahn, K.S., Daily, G.C., & Gross, J.J. (2015). Nature experience reduces rumination and subgenual prerontal cortex activation. Proceedings of the National Academy of Sciences, 112 (28), 8567-72. https://doi.org/10.1073/pnas.1510459112 Cicea, C., Pîrlogea, C. (2011). Green spaces and public health in urban areas. Theoretical and Empirical Researches in Urban Management, 6(1), 83-92. Retrieved From: https://www.researchgate.net/publication/227 inequalities by incelenmesi. 64(2), 41-55. 48(2), 1247-55. Social 138, Science & 22-30. Medicine, 28(2),159- in terms of socio- Dr. Ezgi TOK., et al., 55
JOURNAL OF CONTEMPORARY URBAN AFFAIRS, 4(1), 47-60/ 2020 490457_Green_spaces_and_public_health_in_u rban_areas Health, 13, 407-21. https://doi.org/10.1186/1471- 2458-13-407 Cohen, D.A., McKenzie, T.L., Sehgal, A., Williamson, S., Golinelli, D., & Lurie, N. (2007). Contribution of public parks to physical activity. American Journal of Public Health, 97(3), 509–514. https://doi.org/10.2105/AJPH.2005.072447 Dallimer, M., Tang, Z., Bibby, P., Brindley, P., Gaston, K.J., Davies, Z.G. (2011). Temporal changes in greenspace in a highly urbanized region. Biology Letters, 7(5), 763-766. Retrieved From: https://www.researchgate.net/publication/508 31298_Temporal_changes_in_greenspace_in_a _highly_urbanised_region Ersoy, M. (2015). Kentsel Planlama Standartlar [Standards in Urban Planning], Ninova Yayıncılık, İstanbul. Fan, Y., Das, K.V., Neighborhood green, social support, physical activity, and stress: Assessing the cumulative impact. Health & Place, 17(6), 1202-1211. https://doi.org/10.1016/j.healthplace.2011.08.0 08 Fuller, R., Gaston, K. (2009). The scaling of green space coverage in European cities. Biology Letters 5(3), https://doi.org/10.1098/rsbl.2009.0010 Gascon, M., Triguero-Mas, M., Martinez, D., Dadvand, P., Forns, J., Plasencia, A., & Nieuwenhuijsen, M. J. (2015). Mental health benefits of long-term exposure to residential green and blue spaces: a systematic review. International Journal of Environmental Research and Public Health, https://doi.org/10.3390/ijerph120404354 Grahn P., Stigsdotter, U.A. (2003). Landscape planning and stress. Urban Forestry & Urban Greening, https://doi.org/10.1078/1618-8667-00019 Honold, J., Lakes, T., Beyer, R., & van der Meer, E. (2016). Restoration in urban spaces: Nature views from home, greenways, and public parks. Environment and Behavior, 48(6), 796-825. Retrieved https://doi.org/10.1177/0013916514568556 Huynh, Q., Craig, W., Janssen, I., & Pickett, W. (2013). Exposure to public natural space as a protective factor for emotional well-being among young people in Canada. BMC Public Kaplan, R. (2001). The nature of the view from home: psychological benefits. Environment & Behavior, https://doi.org/10.1177/00139160121973115 Kaczynski, A.T., Potwarka, L.R., & Saelens, B.E. (2008). Association of park size, distance and features with physical activity in neighborhood parks. American Journal of Public Health, 98(8), 1451–1456. https://doi.org/10.2105/AJPH.2007.129064 Koohsari, M.J., Mavoa, Sugiyama, T., Badland, H., Kaczynski, A.T., Owen, N., & Giles-Corti, B. (2015). Public open space, physical activity, urban design and public health: concepts, methods and research agenda. Health https://doi.org/10.1016/j.healthplace.2015.02.0 09 Kremer, P., Hamstead, Z., Haase, D., McPhearson, T., Frantzeskaki, N., Andersson, E., Kabisch, N., Larondelle, N., Rall, E.L., Voigt, A., Baró, F., Bertram, C., Gómez-Baggethun, E., Hansen, R., Kaczorowska, A., Kain, J.H., Kronenberg, J., Langemeyer, J., Pauleit, S., Rehdanz, K., Schewenius, M., van Ham, C., Wurster, D., & Elmqvist, T. (2016). Key insights for the future of urban ecosystem services research. Ecology and Society, http://dx.doi.org/10.5751/ES-08445-210229 Lee, A.C.K., & Maheswaran, R. (2010). The health benefits of urban green spaces: a review of the evidence. Public Health, https://doi.org/10.1093/pubmed/fdq068 Maas, J., Verheij, R., A., Groenewegen, P., P., Vries, S., & Spreeuwenberg, P. (2006). Green space, urbanity, and health: how strong is the relation?. Journal of Epidemiology and Community Health, 7(60), https://doi.org/10.1136/jech.2005.043125 Maas, J., Spreeuwenberg, P., van Winsum-Westra, M., Verheij, R.A., de Vries, S., & Groenewegen, P.P. (2009). Is green space in the living environment associated with people's feelings of social safety?. Environment and Planning A, 41, 1763-1777. https://doi.org/10.1068/a4196 Martinez-Gonzalez, M.A., Varo, J.J., Santos, J.L., De Irala, J., Gibney, M., Kearney, J., & Martínez, J.A. (2001). Prevalence of physical activity during leisure time in the European Union. Medicine & 33, 507–542. S., Villanueva, K., Place, 33, 75–82. & Chen, Q. (2011). 352-355. 21(2), 29. 33(2), 212-22. 12 (4), 4354-4379. 2(1), 1-18. 587-592. From: Dr. Ezgi TOK., et al., 56
JOURNAL OF CONTEMPORARY URBAN AFFAIRS, 4(1), 47-60/ 2020 Science in Sports & Exercise, 33(7), 1142-6. Retrieved From: https://www.ncbi.nlm.nih.gov/pubmed/114457 61 https://www.researchgate.net/publication/271 206461_The_Impacts_of_Green_Areas_on_Mitig ating_Urban_Heat_Island_Effect_A_Review_Pu blished_in_2014 Mekansal Planlar Yapım Yönetmeliği [Spatial Plans Construction Regulation.]. (2014, 14 June). (Regulation No: 29030). Retrieved From: http://www.resmigazete.gov.tr/eskiler/2014/06/ 20140614-2.htm Nielsen, T. S., & Hansen, K. B. (2007). Do green areas affect health? results from a Danish survey on the use of green areas and health indicators. Health & Place, https://doi.org/10.1016/j.healthplace.2007.02.0 01 Oktay, D. (1998). Green spaces and the ecological quality of housing: the case of Cypriot settlements. Ekistics, 391/392/393(65), 283-291. Retrieved From: https://www.jstor.org/stable/43623310?seq=1# metadata_info_tab_contents Paquet, C., Orschulok, T.P., Coffee, N.T., Howard, N.J., Hugo, G., Taylor, A.W., Adams, R.J., & Daniel, M. (2013). Are accessibility and characteristics of associated with a better cardiometabolic health? Landscape and Urban Planning, 118, 70–78. https://doi.org/10.1016/j.landurbplan.2012.11.0 11 Planlı Alanlar İmar Yönetmeliği [Planned Areas Zoning Regulation.] (2017, 3 July).(Regulation No: 30113). Retrieved From: http://www.resmigazete.gov.tr/eskiler/2017/07/ 20170703-8.htm Roberts, H., Sadler, J., & Chapman, L. (2019). The value of twitter data for determining the emotional responses of people to urban green spaces: a case study and critical evaluation. Urban Studies, https://doi.org/10.1177/0042098017748544 Schipperijn, J., Bentsen, P., Troelsen, J., Toftager, M., & Stigsdotter UK. (2013). Associations between physical activity and characteristics of urban green space. Urban Forestry & Urban Greening, https://doi.org/10.1016/j.ufug.2012.12.002 Shishegar, N. (2014). The impact of green areas on mitigating urban heat island effect: a review. The International Journal of Environmental Sustainability, 9(1), 119-30. Retrieved From: Soga, M., Gaston, K. (2016). Extinction of experience: the loss interactions. Frontiers in Ecology and the Environment, https://doi.org/10.1002/fee.1225 Stigsdotter, U., Ekholm, O., Schipperijn, J., Toftager, M., Kamper-Jørgensen, (2010). Health promoting outdoor environments – associations between green space, and health, health-related quality of life and stress based on a Danish national representative survey. Scandinavian Journal of Public Health, 38, 417. https://doi.org/10.1177/1403494810367468 Tamosiunas, A., Grazuleviciene, R., Luksiene, D., Dedele, A., Reklaitiene, R., Baceviciene, M., Vencloviene, Radisauskas, R., Milinaviciene, E., Bobak, A., & Nieuwenhuijsen,M.J. (2014). Accessibility and use of urban cardiovascular health: findings from a Kaunas cohort study. Environment Health, 13:20-31. https://doi.org/10.1186/1476-069X-13-20 Toftager, M., Ekholm, O., Schipperijn, J., Stigsdotter, U., Bentsen, P., Grønbæk, M., Randrup, T.B., & Kamper-Jørgensen, F. (2011). Distance to green space and physical activity: a Danish national representative survey. Journal of Physical Activity and Health, 8, 741-749. Retrieved From: https://www.ncbi.nlm.nih.gov/pubmed/218322 88 Türkiye İstatistik Kurumu [Turkish Statistical Institute]. (2019). Retrieved From: http://www.tuik.gov.tr/PreTablo.do?alt_id=1059 Van den Berg, M., Wendel-Vos, W., van Poppel, M., Kemper, H., van Mechelen, W., & Maas, J. (2015). Health benefits of green spaces in the living environment: a systematic review of epidemiological studies. Urban Forestry & Urban Greening, https://doi.org/10.1016/j.ufug.2015.07.008 Verheij, R., A., Maas, J., & Groenewegen, P., P. (2008). Urban–rural health differences and the availability of green space. European Urban and Regional Studies, https://doi.org/10.1177/0969776408095107 of human-nature 14(2), 94-101. F., & Randrup, T,B. 13(4), 839-850. 411- J., Malinauskiene, Bernotiene, G., V., M., Peasey, green spaces and public open spaces 56(4), 818–835. 14, 806-816. 12,109–116. 15(4), 307–316. Dr. Ezgi TOK., et al., 57
JOURNAL OF CONTEMPORARY URBAN AFFAIRS, 4(1), 47-60/ 2020 Villeneuve, P.J, Jerrett, M., Su, G.J., Burnett, R.T., Chen, H., Wheeler, A., & Goldberg, M.S. (2012). A cohort study relating urban green space with mortality in Ontario, Canada. Environment Research, https://doi.org/10.1016/j.envres.2012.03.003 World Health Organization. (2018). Physical activity for health: more active people for a healthier world: draft global action plan on physical activity 2018–2030. Seventy-First World Health Assembly Provisional Retrieved From: http://apps.who.int/gb/ebwha/pdf_files/WHA7 1/A71_18-en.pdf Zaid, M.A. (2015). Correlation and Regression Analysis, SESRIC:Turkey, http://www.oicstatcom.org/file/TEXTBOOK- CORRELATION-AND-REGRESSION-ANALYSIS- EGYPT-EN.pdf 115,51-8. Agenda Item 12.2. How to Citethis Article: Tok, E , Ağdaş, M.G., Özkök, M.K and Kuru, A. (2020). Socio- Psychological Effects of Urban Green Areas: Case of Kirklareli City Center. Journal of Contemporary https://doi.org/10.25034/ijcua.2020.v4n1-5 Affairs, 4(1), 47-60. Urban 4-12. Appendix 1: Survey Frequency Analysis Table for Main and Control Group. Survey evauation by users that answered the "do you have any discomfort?" (see question 36) " as "psychological discomfort” Survey evaluation by other users I. User Profile Age Groups Frequency Percent (%) Age Groups Frequency Percent (%) Young (0-17) 24 3.2 Young (0-17) 2 6.5 Adult (18-64) 689 93.2 Adult (18-64) 28 90.3 Elderly (65+) 26 3.5 Elderly (65+) 1 3.2 Total 739 100.0 Total 31 100.0 Minimum Age: 12 Minimum Age: 16 Maximum Age: 85 Maximum Age: 67 Average Age: 32 Average Age: 26 Gender Frequency Percent (%) Gender Frequency Percent (%) Male 429 58.1 Male 23 74.2 Female 310 41.9 Female 8 25.8 Total 739 100.0 Total 31 100.0 Education Status Frequency Percent (%) Education Status Frequency Percent (%) Literate 101 13.7 Literate Elementary school 2 6.5 Illiterate 25 3.4 7 22.6 Elementary school 109 14.7 Secondary school 6 19.4 Secondary school 206 27.9 University 16 51.6 Total 31 100.0 University Total 298 40.3 739 100.0 II. User Satisfaction Walking Time To Nearest Park 5 minutes Frequency Percent (%) Walking Time To Nearest Park Frequency Percent (%) 278 37.6 5 minutes 10 32.3 6-10 minutes 178 24.1 6-10 minutes 10 32.3 11-15 minutes 11-15 minutes 4 12.9 125 16.9 16-20 minutes 86 11.6 16-20 minutes 2 6.5 20 minutes and more 71 9.6 20 minutes and more 5 16.1 Total 739 100.0 Total 31 100.0 Dr. Ezgi TOK., et al., 58
JOURNAL OF CONTEMPORARY URBAN AFFAIRS, 4(1), 47-60/ 2020 Purpose of Park Usage Frequency Percent (%) Purpose of Park Usage Recreation Frequency Percent (%) Rekreation 256 35.4 17 54.8 Spor Spor 122 16.9 5 16.1 Social activities Social activities 3 9.7 253 28.0 Closeness to the place where they live Closeness to the place where they live 88 12.2 1 3.2 Socialization 50 6.9 Others 5 16.1 Others 5 .7 Total 31 100.0 Total 724 100.0 Frequency of Park Usage Frequency Percent (%) Frequency of Park Usage Frequency Percent (%) Never Never 27 3.7 1 3.2 Once in mount Once in mount 127 17.3 8 25.8 Once in week Once in week 7 22.6 261 35.6 More than one in week More than one in week 251 34.2 9 29.0 Everyday Everyday 67 9.1 6 19.4 Total 733 100.0 Total 31 100.0 Spending Time in a Park 15 minutes and less Frequency Percent (%) Spending Time in a Park Frequency Percent (%) 396 57.6 15 minutes and less 19 61.3 15-30 minutes 15-30 minutes 6 19.4 176 25.6 30-60 minutes 87 12.6 30-60 minutes 4 12.9 60 minutes and more 29 4.2 60 minutes and more 2 6.5 Total 688 100.0 Total 31 100.0 II.I. Question 27. Do the following have a positive impact on the use of the nearby park / green area? (Prominent 3 answers) Urban Furniture Yes Frequency Percent (%) Accesibility Frequency Percent (%) 311 42.1 Yes 15 48.4 No 428 57.9 No 16 51.6 Total 739 100.0 Total 31 100.0 Facilities Yes Frequency Percent (%) Urban Furniture Frequency Percent (%) 309 41.8 Yes 12 38.7 No 430 58.2 No 19 61.3 Total 739 100.0 Total 31 100.0 Landscape Elements Yes Frequency Percent (%) Landscape Elements Frequency Percent (%) 253 34.2 Yes 8 25.8 No 486 65.8 No 23 74.2 Total 739 100.0 Total 31 100.0 II.II. Question 28. Do the following have a negative impact on the use of the nearby park / green area? (Prominent 3 answers) Pollution Frequency Percent (%) Pollution Frequency Percent (%) Yes 384 52.0 Yes 13 41.9 No 355 48.0 No 18 58.1 Total 739 100.0 Total 31 100.0 Noise Frequency Percent (%) Noies Frequency Percent (%) Yes 347 47.0 Yes 10 32.3 No 392 53.0 No 21 67.7 Total 739 100.0 Total 31 100.0 Lack of Lighting in Evening / Insecurity (two different answers at the same rate) User Profile Change for Night Time Frequency Percent (%) Frequency Percent (%) Yes 241 32.6 Yes 9 29.0 No 498 67.4 No 22 71.0 Total 739 100.0 Total 31 100.0 Dr. Ezgi TOK., et al., 59
www.ijcua.com This page is intentionally left blank.