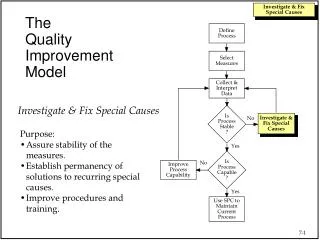
The Quality Improvement Model
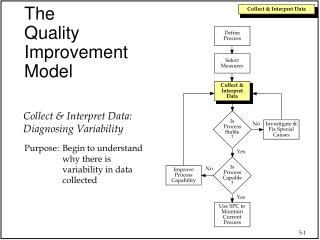
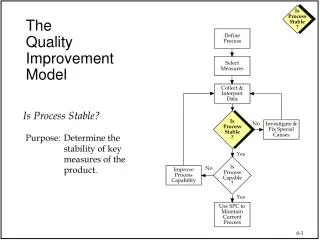
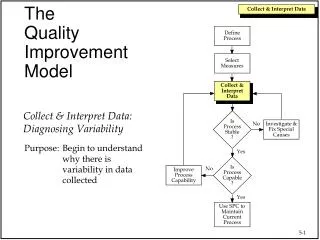
The Quality Improvement Model. Define Process. Select Measures. Collect & Interpret Data. Collect & Interpret Data: Diagnosing Variability. Is Process Stable ?. No. Investigate & Fix Special Causes. Purpose: Begin to understand why there is variability in data collected. Yes.

The Quality Improvement Model
E N D
Presentation Transcript
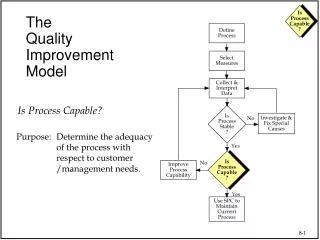
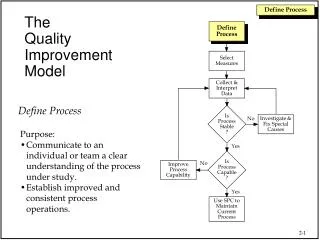
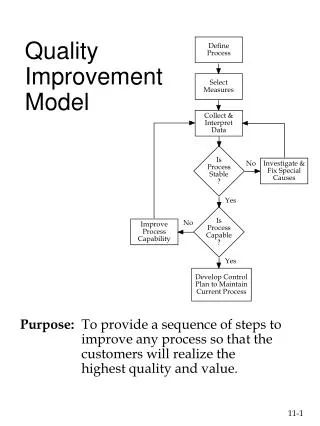
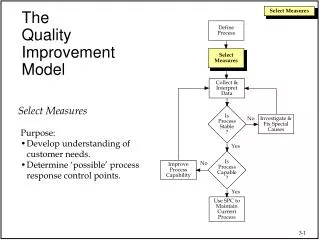
TheQualityImprovementModel Define Process Select Measures Collect & Interpret Data Collect & Interpret Data: Diagnosing Variability IsProcessStable? No Investigate & Fix Special Causes Purpose: Begin to understand why there is variability in data collected Yes IsProcessCapable? No Improve Process Capability Yes Use SPC to Maintain Current Process
1 2 3 4 5 6 7 8 9 10 11 12 What size shoe do you wear? Size 11 Shoes Why aren’t size 11’s all the same size?
GC CHDM Test Method Example Why don’t we get the same %Water value?
Cause & Effect Matrix – A Tool to Identify and Quantify Sources of Variation Cause & Effects Matrix
Cause and Effects Matrix • Relates the key inputs to the key outputs (customer requirements) using the process map as the primary information source • Key outputs are scored as to importance to the customer • Key inputs are scored as to relationship to key outputs • Pareto of key inputs to evaluate in the FMEA and control plans • Input into the initial evaluation of the Process Control Plan
Cause & Effect Matrix Steps • Identify key customer requirements (outputs) from process map or other sources • Rank order and assign priority factor to each Output (usually on a 1 to 10 scale) • Identify all process steps and materials (inputs) from the Process Map • Evaluate correlation of each input to each output • low score: changes in the input variable (amount, quality, etc.) have small effect on output variable • high score: changes in the input variable can greatly affect the output variable • Cross multiply correlation values with priority factors and sum for each input
Examples Note: Only a partial list
Bottle Production Example Note: Only a partial Map
Cause & Effect Matrix Form 1. List Key Outputs Excel Template C&E Matrix.XLS
Bottle Production Example 1. List Key Outputs The Outputs are defined in Step 1 of Process Mapping
Cause & Effect Matrix Form 2. Rank Outputs as to Customer importance
Bottle Production Example 2. Rank Outputs as to Customer importance
Cause & Effect Matrix Form 3. List Key Inputs by Process Step Note: Information obtained from process map
Bottle Production Example 3. List Key Inputs by Process Step This step uses the Process Map inputs directly. Notice the Process Inputs follow the Process map step-by-step. Note: Only a partial list of inputs
Cause & Effect Matrix Form 4. Relate Inputs to Outputs
Relating Inputs to Customer Requirements • You are ready to relate the customer requirements to the process input variables • Correlational scores: No more than 4 levels • 0, 1, 3 and 9 • Assignment of the scoring takes the most time • To avoid this, spell out the criteria for each score: 0= No correlation 1= The process input only remotely affects the customer requirement 3 = The process input has a moderate effect on the customer requirement 9 = The process input has a direct and strong effect on the customer requirement
Bottle Production Example 4. Relate Inputs to Outputs Note: Only a partial list of inputs This is a subjective estimate of how influential the key inputs are on the key outputs
Cause & Effect Matrix Form 5. Cross-multiply and prioritize Sum of (Rating x Correlation Score) values for all Requirements
Bottle Production Example 5. Cross-multiply and prioritize Note: Only a partial list of inputs We now start getting a feel for which variables are most important to explaining variation in the outputs
Bottle Production Example We have sorted on the cross-multiplied numbers and find that the input variables in the box above are the most important We can now evaluate the control plans for these input variables Note: Only a partial list of inputs
Minitab: Creating Pareto Plots Open the Minitab Worksheet C and E in the Minitab Datasets folder. Follow the commands on pages 5-21 and 5-22 to create a Pareto Chart. Stat > Quality Tools > Pareto Chart Choose Chart defects table Enter the information as shown below
Minitab: Creating Pareto Plots Choose Options Select Do not chart cumulative percent Hit OK twice
General Approach • Place the outputs across the top of the matrix and rank • Place inputs down the side of the matrix starting with the first process step and moving to the last • This approach is okay for small process with relatively few steps • Should only be used for processes with a relatively small number of steps and inputs
Focused Approach • Phase I • Place the outputs across the top of the matrix and rank • Place the process steps down the side of the matrix • Correlate process step to outputs • Pareto the process steps • Phase II • Start a new C&E Matrix with the inputs from the top three or four process steps • Recommended when first starting a project • Focuses the efforts and gives the team a feeling that they’re working on the important process steps first • Gives you a running start at the FMEA and preliminary Control Plan Analysis
Control Plan Evaluation • Standard Operating Procedures • Do they exist? • Are they understood? • Are they being followed? • Are they current? • Is operator certification performed? • Is there a process audit schedule?
Control Plan Evaluation • Controllable Input Variables: • How are they monitored? • How often are they verified? • Are optimum target values and specifications known? • How much variation is there around the target value? • How consistent are they? • Other Questions: • How often is the input variable out of control? • Which input variables should have control charts?
Exercises 1.) Your Catapult Team should complete page 8 of the blue “Catapult Process” handout. 2) Copy/Paste your results into PowerPoint 3) Be ready to present your results Limit yourselves to 30 minutes for this exercise.